This article originally appeared in The Bar Examiner print edition, Spring 2022 (Vol. 92, No. 1), pp. 5.
February 2023 MBE
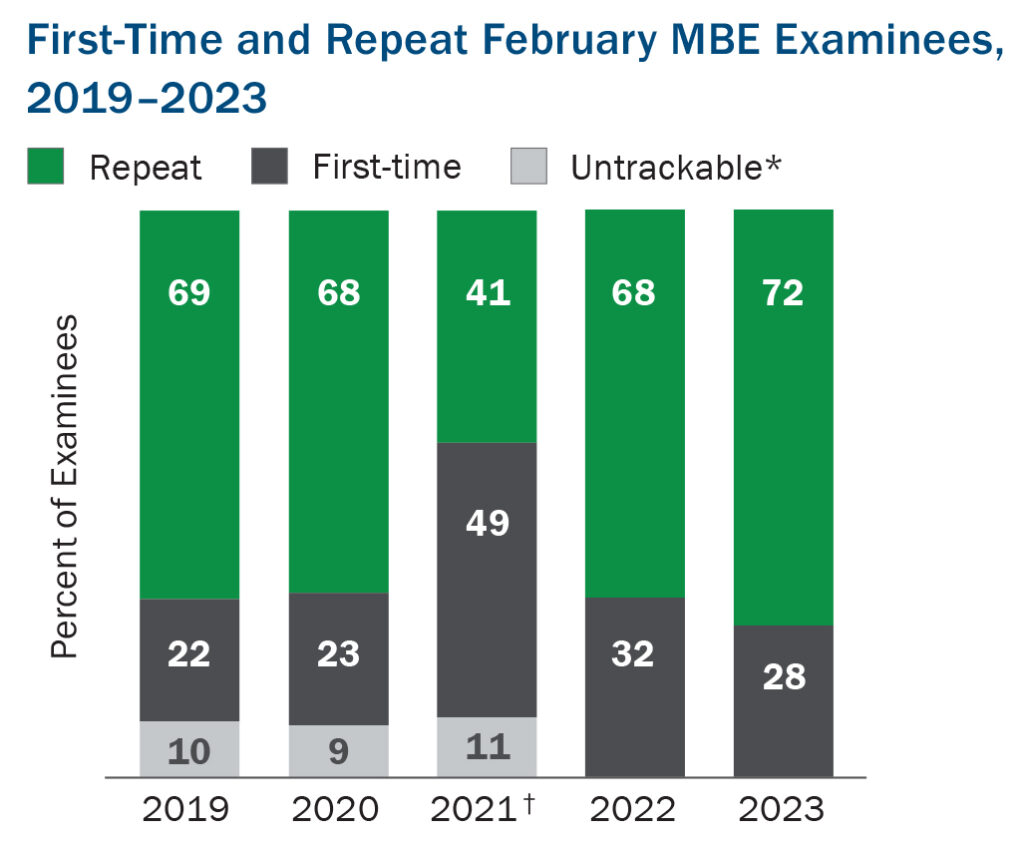
February 2023 MBE Examinees: 19,228

February 2023 MBE Mean Score: 131.1


First-time and repeat examinee percentages are an approximation based on NCBE Number and biographic data.* The first-time and repeat MBE-based test taker information calculated by NCBE is an approximation based on the NCBE Number and biographic data, which has not been used consistently in all jurisdictions across time. Prior to 2022, approximately 10% of examinees were unable to be tracked with certainty by NCBE as either first-time or repeat takers due to a lack of sufficient biographic information. As of 2022, all jurisdictions have provided the necessary information for a sufficient number of administrations to allow for adequate tracking.† Because information about first-time and repeat test takers is based on whether an examinee has previously taken the MBE, attempts made by examinees who sat for an exam during the July 2020 exam cycle but did not take the full, in-person MBE are not reflected in the determination of status. As a result, it is likely that first-timer values for February 2021 are somewhat inflated and those of repeaters are depressed.
MBE Standard Deviations
|
February |
|
| 2019 | 15.2 |
|
2020 |
15.6 |
|
2021 |
16.5 |
|
2022 |
15.4 |
|
2023 |
15.1 |
MBE scores are reported on a scale ranging from 0 to 200. The values reflect valid scores available electronically as of 3/31/23.
Did you know?
NCBE publishes up-to-date information on bar exam pass rates as jurisdictions release their results after each exam administration.
Visit www.ncbex.org/statistics-and-research/bar-exam-results/ to see pass rates by jurisdiction for the February 2023 exam.
2022 Year in Review
In 2022, NCBE
• conducted 15,046 character and fitness investigations on behalf of 28 jurisdictions;
• scored, equated, scaled, and performed other statistical analyses on 160,478 exams for 55 jurisdictions;
• transferred 23,329 MPRE scores to jurisdictions, and released 7,017 MPRE score transcripts to examinees; and
• saw 46,000 visits to the Bar Examiner website, and 104,000 visits to the Comprehensive Guide to Bar Admissions website.
For more information on NCBE’s activities in 2022, see the 2022 Year in Review, available at www.ncbex.org/assets/Uploads/NCBE-2022-Year-In-Review-Final.pdf.
Contact us to request a pdf file of the original article as it appeared in the print edition.


