October 2020 MPRE

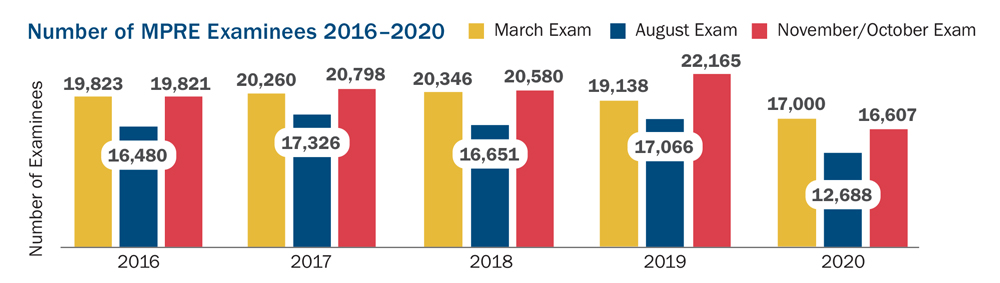
October 2020 MPRE Examinees 16,607

This bar graph shows the number of MPRE examinees in the years 2016 through 2020 for the March, August, and November/October exams. In 2016 there were 19,823 examinees for the March exam, 16,480 for the August exam, and 19.821 for the November/October exam. In 2017, there were 20,260 examinees for the March exam, 17,326 for the August exam, and 20,798 for the November/October exam. In 2018 there were 20,346 examinees for the March exam, 16,651 for the August exam, and 20,580 for the November/October exam. In 2019 there were 19,138 examinees for the March exam, 17,066 for the August exam, and 22,165 for the November/October exam. In 2020 there were 17,000 examinees for the March exam, 12,688 for the August exam, and 16,607 for the November/October exam.

October 2020 MPRE Mean Score 98.8 (score scale 50–150)

This line graph shows MPRE mean scores from the years 2016 through 2020 for the March, August, and November/October exams. The mean score for the March exam was 93.5 in 2016, 92.7 in 2017, 94.7 in 2018, 93.8 in 2019, and 95.8 in 2020. The mean score for the August exam was 92.0 in 2016, 93.7 in 2017, 93.0 in 2018, 93.4 in 2019, and 98.6 in 2020. (Comparability to prior results may be limited due to the lower examinee count in August 2020.) The mean score for the November/October exam was 93.5 in 2016, 94.1 in 2017, 95.5 in 2018, 97.0 in 2019, and 98.8 in 2020. (Comparability to prior results may be limited due to the lower examinee count in October 2020.)

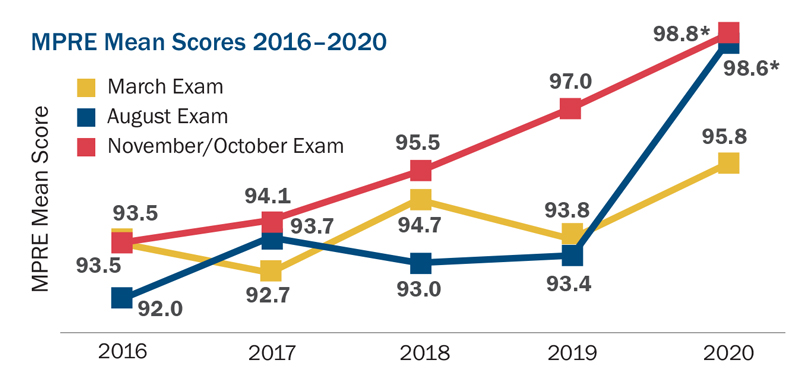
* Comparability to prior results may be limited due to the lower examinee count in August and October 2020.

MPRE Standard Deviations


March

August

November/October

2016

17.6

17.7

17.3

2017

17.1

18.0

17.4

2018

17.9

17.8

18.2

2019

17.9

17.5

18.3

2020

18.5

18.3

18.8

MPRE scores are reported on a scale ranging from 50 to 150. The values reflect valid scores available electronically on both standard and alternative forms as of 11/18/20 for the October MPRE.

February 2021 MBE

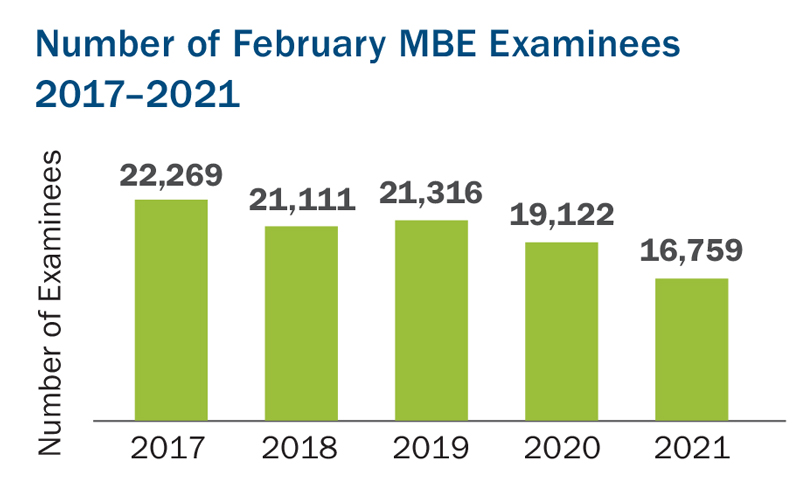
16,759 February 2021 MBE Examinees

This bar graph shows the number of February MBE examinees in the years 2017 to 2021. The number of February MBE examinees in 2017 was 22,269; in 2018 it was 21,111; in 2018 it was 21,316; in 2020 it was 19,122; and in 2021 it was 16,759.

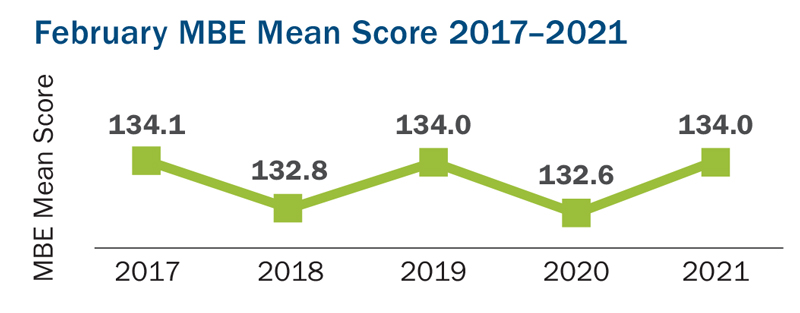
February 2021 MBE Mean Score 134.0

This line graph shows February MBE mean scores from the years 2017 to 2021. In 2017, the February MBE mean score was 134.1; in 2018 it was 132.8; in 2019 it was 134.0; in 2020 it was 132.6; and in 2021 it was 134.0.

MBE Standard Deviations


February

2017

14.7

2018

16.0

2019

15.2

2020

15.6

2021

16.5

MBE scores are reported on a scale ranging from 0 to 200. The values reflect valid scores available electronically as of 3/24/21.

  • Bar
    Bar Exam Fundamentals

    Addressing questions from conversations NCBE has had with legal educators about the bar exam.

  • Online
    Online Bar Admission Guide

    Comprehensive information on bar admission requirements in all US jurisdictions.

  • NextGen
    NextGen Bar Exam of the Future

    Visit the NextGen Bar Exam website for the latest news about the bar exam of the future.

  • BarNow
    BarNow Study Aids

    NCBE offers high-quality, affordable study aids in a mobile-friendly eLearning platform.

  • 2023
    2023 Year in Review

    NCBE’s annual publication highlights the work of volunteers and staff in fulfilling its mission.

  • 2023
    2023 Statistics

    Bar examination and admission statistics by jurisdiction, and national data for the MBE and MPRE.