This article originally appeared in The Bar Examiner print edition, Fall 2023 (Vol. 92, No. 3), pp. 6.
July 2023 MBE
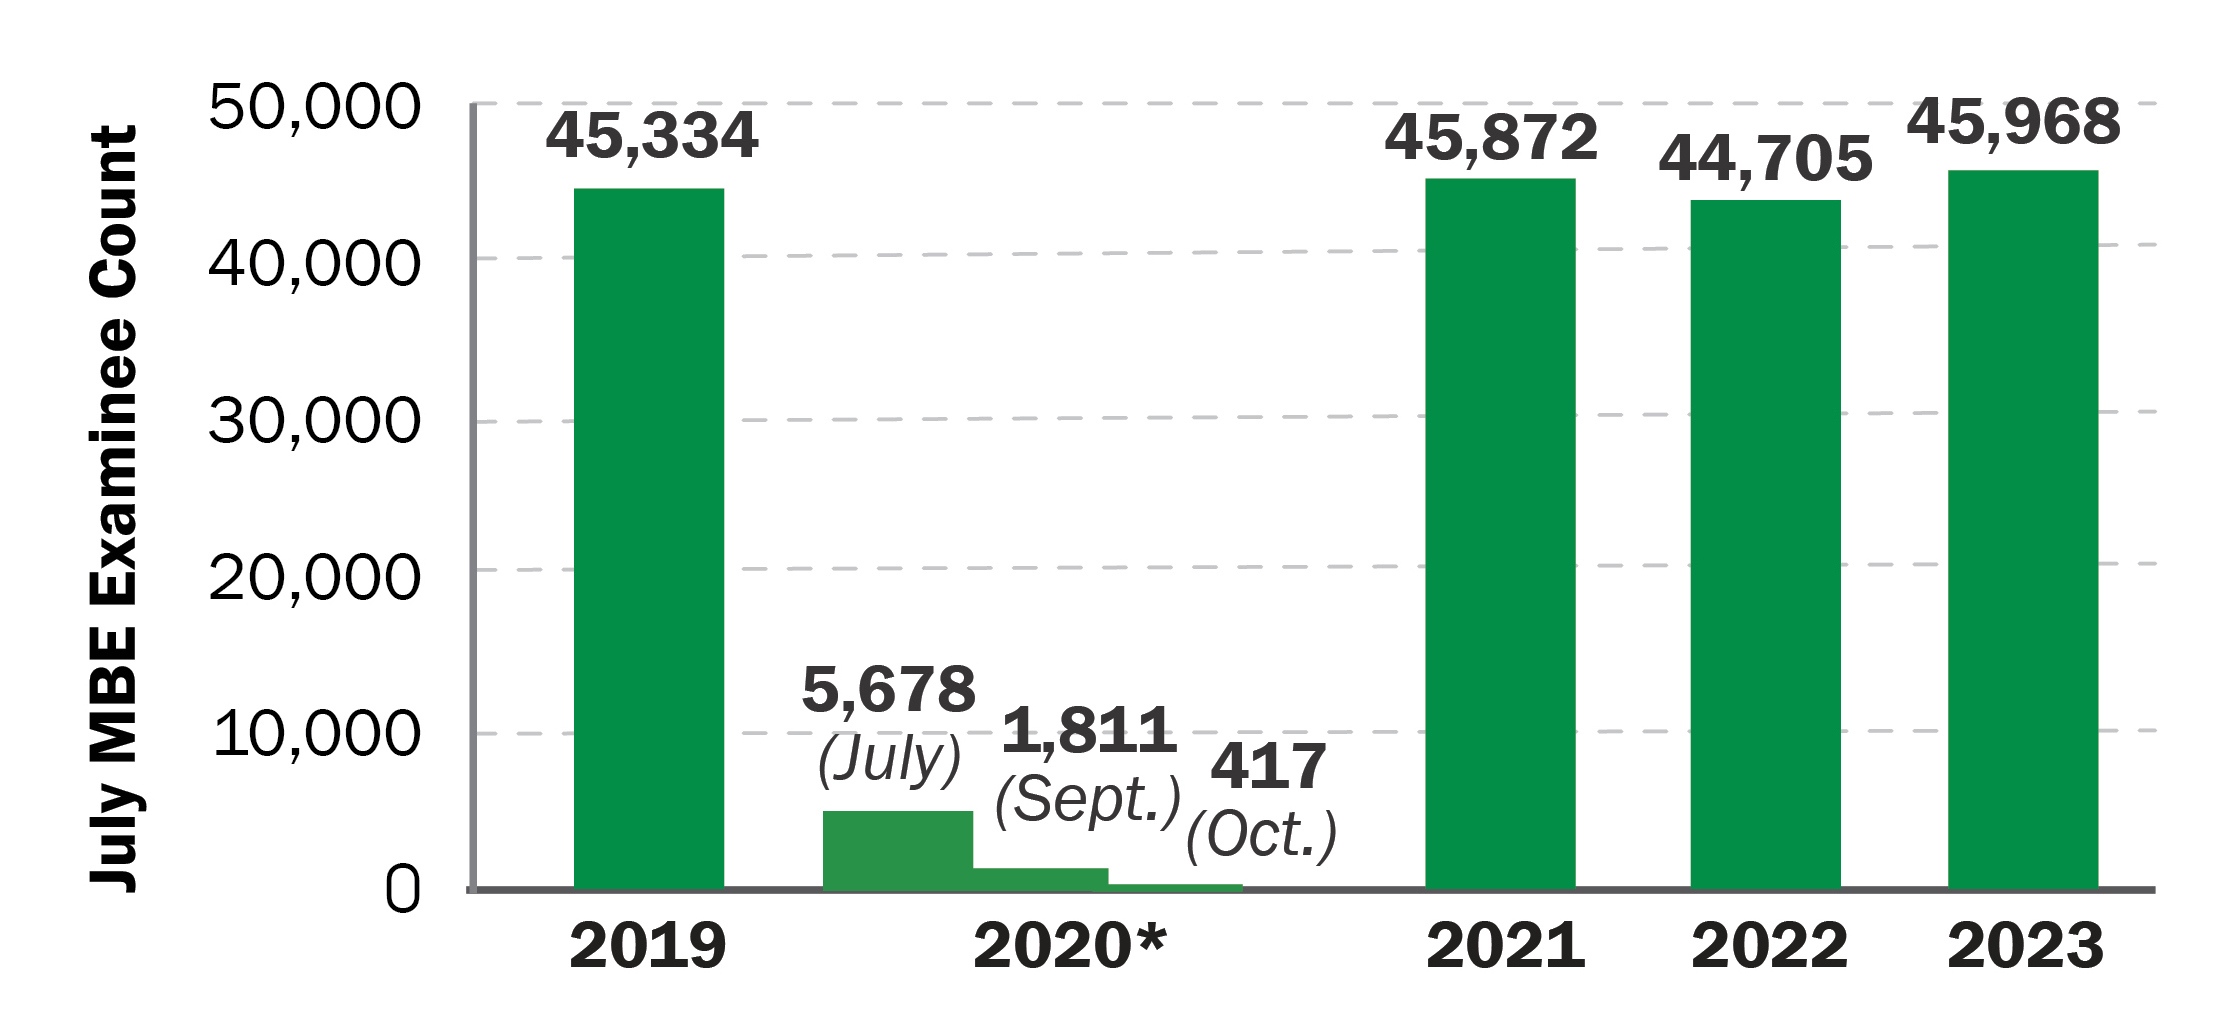
July 2023 MBE Examinees: 45,968
Number of July MBE Examinees, 2019–2023
July 2023 MBE Mean Score: 140.5
July MBE Mean Scaled Scores, 2019–2023
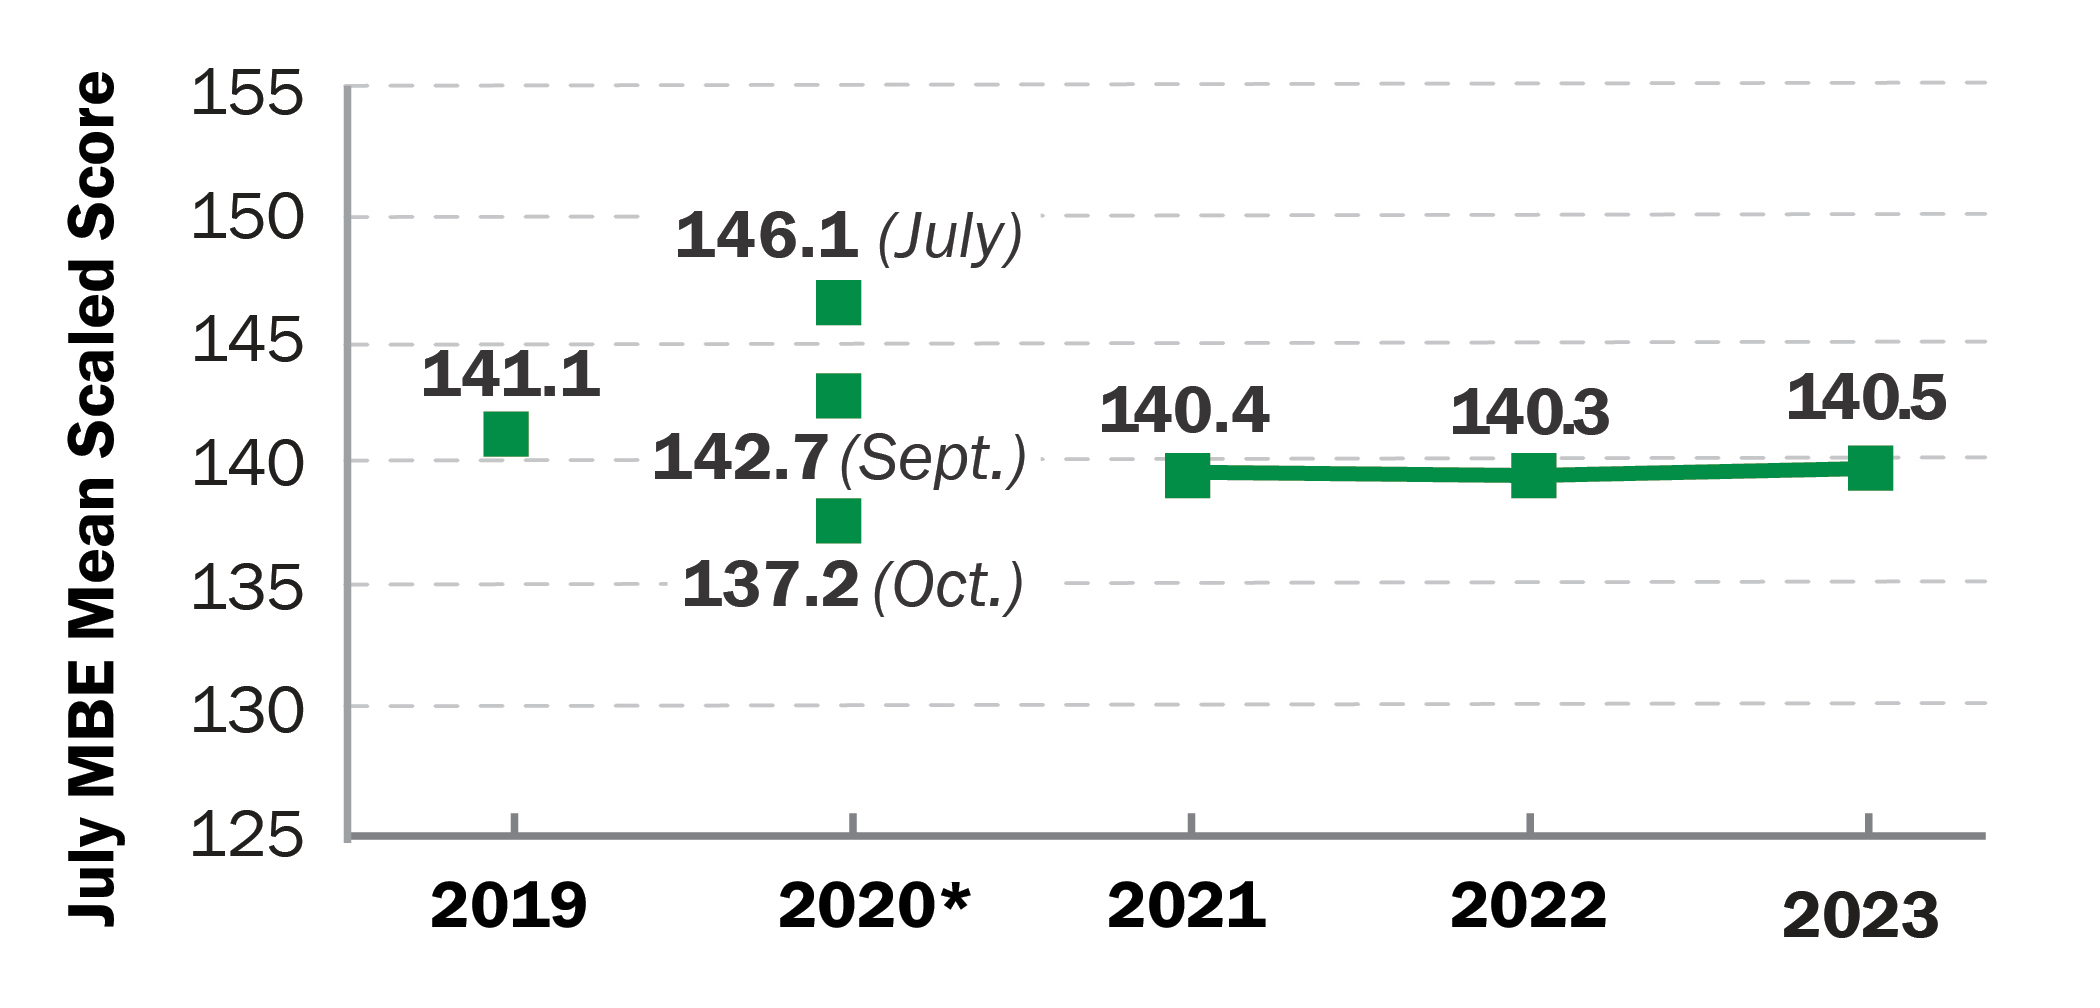
* Due to the COVID-19 pandemic, the July 2020 MBE was administered on three separate dates: July 29, September 10, and October 1. The results shown are for in-person examinees only; approximately 29,000 additional examinees sat for a remotely administered exam using NCBE materials in October 2020. Comparability to other years’ results may be limited due to the lower examinee count.
MBE Standard Deviations
|
July |
|
| 2019 | 16.9 |
|
2020 |
15.8 (July), 15.0 (Sept.), 17.8 (Oct.) |
|
2021 |
17.8 |
|
2022 |
17.0 |
|
2023 |
17.1 |
MBE scores are reported on a scale ranging from 0 to 200. The values reflect valid scores available electronically as of 9/21/23.
August & November 2023 MPRE
August 2023 MPRE Examinees: 19,005
November 2023 MPRE Examinees: 21,275
Number of MPRE Examinees, 2019–2023

The values in this chart reflect valid scores available electronically as of 9/15/23.
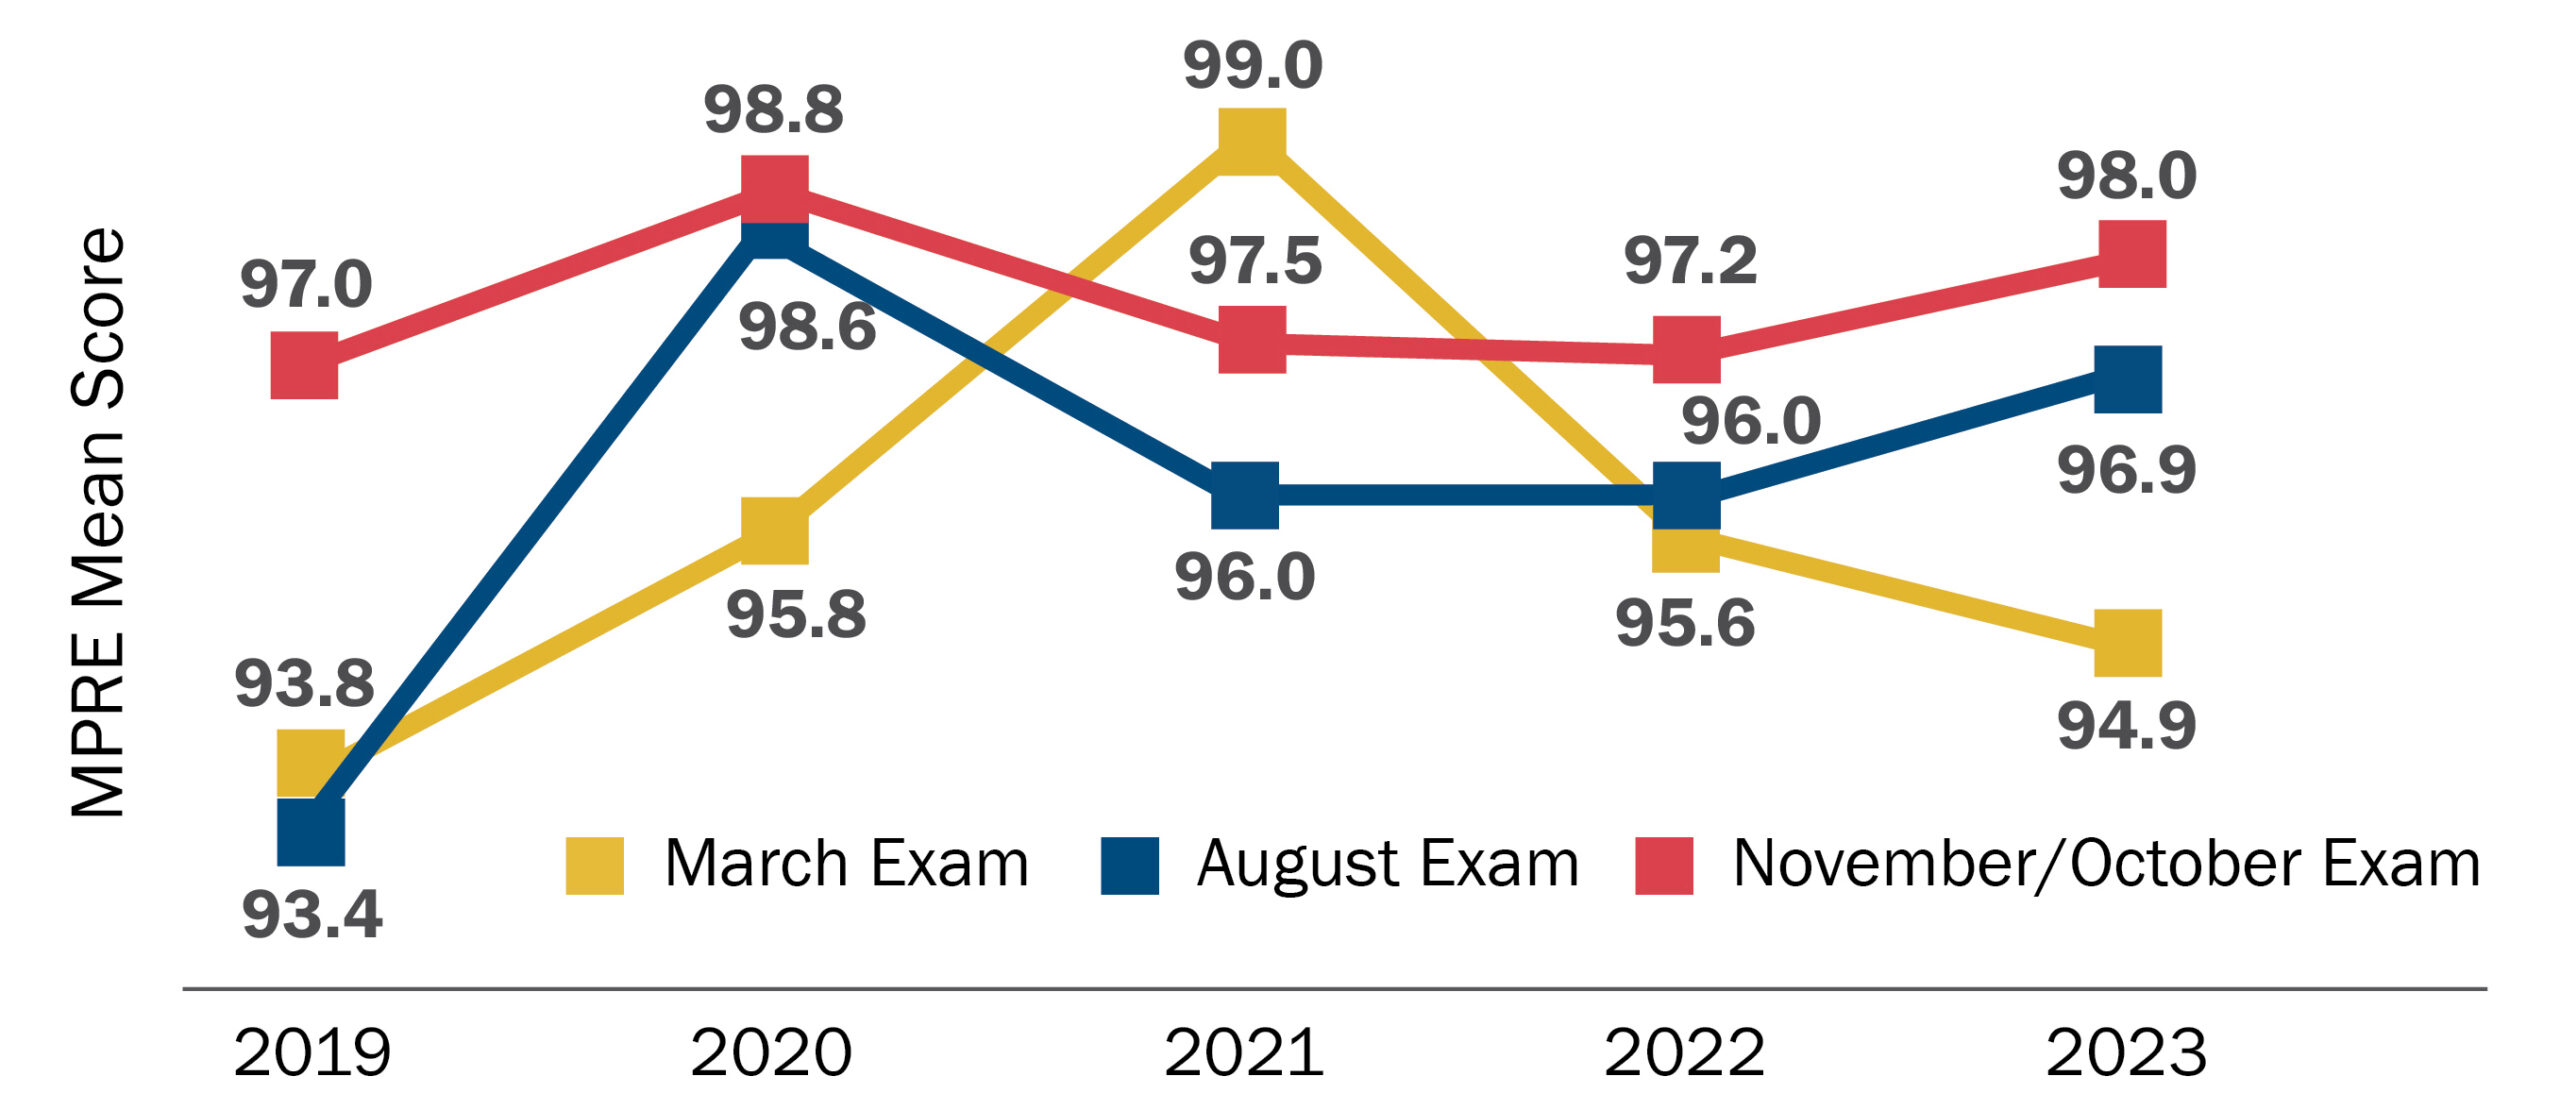
August 2023 MPRE Mean Scores: 96.9
November 2023 MPRE Mean Scores: 98.0
(score scale 50–150)
MPRE Mean Scores, 2019–2023
MPRE Standard Deviations
| Year | March | August | November |
|---|---|---|---|
| 2019 | 17.9 | 17.5 | 18.3 |
| 2020 | 18.5 | 18.3 | 18.8 |
| 2021 | 18.7 | 19.1 | 19.3 |
| 2022 | 18.6 | 18.5 | 19.3 |
| 2023 | 19.2 | 19.7 | 18.8 |
MPRE scores are reported on a scale ranging from 50 to 150. The values reflect valid scores available electronically as of 9/15/23 for August MPRE and 12/5/23 for the November MPRE.Comparability of results may be limited due to fluctuations in examinee counts.
Contact us to request a pdf file of the original article as it appeared in the print edition.