This article originally appeared in The Bar Examiner print edition, Fall 2018 (Vol. 87, No. 3), pp 30–39.
By Mark A. Albanese, Ph.D.

In July 2018, the mean score on the Multistate Bar Examination (MBE) was 139.5, a 2.2-point decline from the mean score in July 2017 and the lowest July mean score since 1984. Only 2 of 50 jurisdictions (testing 10 or more examinees) had higher MBE scores in July 2018 than a year earlier. Based upon MBE scores alone (jurisdictions include scaled written scores in determining their final pass rates), the estimated national pass rate is projected to be 58%, down roughly 6 percentage points from July 2017. This follows upon the heels of the February 2018 MBE results, which were the lowest on record.
In my previous column, which addressed the February 2018 MBE results,1 I recalled the sharp 2.8-point drop in the mean score on the July 2014 MBE—the largest year-to-year drop in the past 34 years at that time—and my speculation about whether that decline was a rogue wave or the leading edge of a storm surge to be repeated as the decline in the number of law school applicants and the LSAT scores of those admitted worked its way through the system. The storm surge clearly continues. In reviewing what may have contributed to the February 2018 decline in MBE scores, I noted that the particularly poor performance of the large number of repeaters largely accounted for the sharp drop in overall performance. I also pointed out that there were some positive indicators, such as the fact that July MBE mean scores had been rising for the last two administrations, and the fact that the March 2018 mean score for the Multistate Professional Responsibility Examination (MPRE) of 94.7 was the highest it had been in March since 2012. Clearly, these positive indicators did not, in fact, portend an increase in the July 2018 MBE mean score. So how can we explain the July results?
What We Know So Far
The MBE is an equated exam, which means, in very general terms, that we reuse certain test questions from prior administrations to “anchor” the exam and measure changes in examinee performance across cohorts and exam forms. For those questions that had been repeated from a previous July exam, the performance decrease on those items was consistent with the decrease found for the mean scaled score, indicating that the July 2018 examinees performed less well than previous July examinees. The reliability of the July 2018 MBE (a measure of the extent to which a group of examinees would be rank-ordered the same way over multiple testing sessions) was 0.93, the same as in the past two July administrations and the highest it has ever been. Thus, the low mean score occurred at a point where the precision of the MBE was maintained at an all-time high. It is worth noting that the 45,274 examinees who took the July 2018 bar examination represented the lowest number of July examinees since 2001 and a 2.9% decline from the 46,627 who took the examination in July 2017.
Who Typically Are the July Examinees?
As I did in my column about the February 2018 results, I will start my analysis of what might have occurred with the July results by describing who takes the bar examination in July. The most obvious reason for an examinee to take the July bar examination is that it is the earliest opportunity to take the bar exam after graduating from law school. The large majority of July examinees are first-time takers who are recent law school graduates. In July 2018, 65% of the examinees were likely first-time takers. (We qualify our designation to any group of takers as being “likely,” as it is based on the somewhat limited information available to us; we do not have the definitive data in one place to make conclusive designations.) This is up 1.3% from July 2017 and would normally be a harbinger of good things to come. However, the mean MBE score for the July 2018 likely first-time takers was 142.9, a full 2.0 points lower than in July 2017 (144.9).
The likely repeat takers did not help matters.2 Although their relative percentage of the total number of examinees was down slightly by 0.7% from July 2017, their mean scaled score on the MBE was down 3.1 points from 134.2 in July 2017 to 131.1 in July 2018. Breaking the repeaters down into what we call strong repeaters versus weak repeaters (strong repeaters being those who scored over 5 points higher than the passing score in the jurisdiction where they previously took the bar examination), we found 0.6% fewer strong repeaters in July 2018. Their mean MBE score was down by 1.2 points from 153.2 in July 2017 to 152.0 in July 2018. Weak repeater representation (weak repeaters being those who are returning to their original testing jurisdiction in fewer than three years) was down by 0.1% from July 2017 levels, and the mean MBE score for the weak repeaters was down by 2.8 points. Even the examinees for whom we could not determine first-time versus repeater status contributed to the decline, as their mean MBE score was down 2.5 points from 141.2 in July 2017 to 138.7 in July 2018. Basically, the decline was broad-based and hit every type of examinee who sat for the July 2018 bar examination.
What Explains the Decline in July 2018 MBE Scores?
Why, when MBE scores had increased in both July 2016 and July 2017, did the July 2018 MBE scores decline to a level that was the lowest since 1984? In my previous column, searching for reasons for the decline in February 2018, I mentioned that to really get at the root cause of the low MBE score surge, it would be ideal to have a complete record of each examinee’s academic performance throughout his or her education. Unfortunately, we do not have this information. As a proxy, we can use what data we have at NCBE along with data available from the Law School Admission Council and the ABA Section of Legal Education and Admissions to the Bar to get a better idea of what might have contributed to the decline.
LSAT Indicators
From the sources of data available, the single best indicator of the decline may be LSAT scores. The fact that LSAT scores are standardized and equated makes them comparable across time and with different cohorts of examinees. (Other indicators such as law school grades lack this standardization and consistent meaning across time.) If we track back to when the July 2018 bar examinees would have entered law school, we can identify them as likely 2015 entrants who would have been on track to graduate in May 2018. So the 2015 entrants to law school would be the most likely first-time takers of the July 2018 bar examination, and with first-time takers representing 65% of the July 2018 examinees, data from these 2015 entrants will provide the most likely indicator of what may have happened on the July 2018 bar examination.
In addition to LSAT scores, the number of law school applicants and also MPRE mean scores can help shed light on the July 2018 MBE performance.
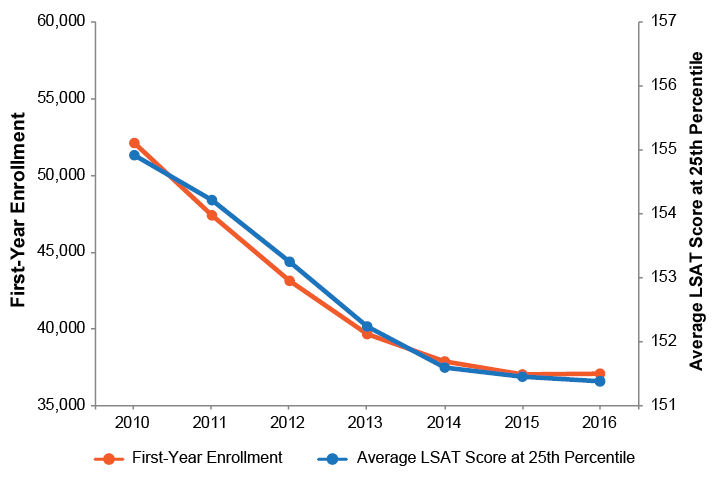
Figure 1 shows the 25th percentile LSAT scores and changes in first-year enrollment from 2010 to 2016. The 25th percentile LSAT score is particularly relevant for this discussion because it reflects the group most likely to fail the bar examination. In 2015, which is when most of the July 2018 examinees would likely have entered law school, the 25th percentile LSAT score was the lowest it had been since at least 2010. (The same is true for the 50th percentile and 75th percentile LSAT scores.) It is worth noting that the entering class of 2015 also had the fewest LSAT takers, the fewest applicants, and the lowest first-year enrollment since at least 1995.
Figure 1: Changes in First-Year Enrollment and Average LSAT Score at the 25th Percentile, 2010–2016
A Visual Perspective on the Relative Trends
In addition to LSAT scores, the number of law school applicants and also MPRE mean scores can help shed light on the July 2018 MBE performance. To get a better visual perspective on the relative trends for the various indicators, I used a variation of a statistic called Cohen’s kappa. Generally, this statistic expresses proportions adjusted for the possibility of random success. For example, suppose an examinee gets 65% correct on a multiple-choice test with four answer options for each question. If the examinee were to randomly pick an answer, he or she would have a 25% chance of being correct, since there are four options, one of which is the correct answer. The kappa value (or kappa) is computed by taking the percentage correct obtained (65%), subtracting the percentage expected by chance (25%), and dividing the resulting value by the difference between the maximum percentage (100%) and the percentage expected by chance (25%). So, the kappa value in this case would be (65-25) / (100-25) = 40/75 = 0.533.
The variation I used substituted the minimum value of a variable over a specified range (in this case, a 21-year time span for the July bar examination) for the percentage expected by chance, and rather than 100 being the maximum in all cases, I used the maximum value of the variable over the specified range. For example, the number of applicants to law school over the 21-year period had a maximum value of 100,600 and a minimum value of 59,400. In 2014, those graduating from law school were among 78,500 applicants in 2011. The kappa value for the July 2014 examinees, therefore, was (78,500-59,400) / (100,600-59,400) = 19,100/41,200 = 0.4636.
Since kappa values within the range of scores used for defining minimum and maximum values could assume a maximum value of 1 and a minimum value of 0, their interpretation was within that range. So the kappa value of 0.46 for the July 2014 examinees indicates that the number of applicants for that group was approximately in the middle of the values.
The data I used for the MBE mean scores went back to 1998. Because the law school entry data (LSATs administered and number of applicants) pertaining to any given July MBE administration is typically from three years earlier (i.e., those taking the July 1998 bar examination would likely have entered law school in 1995), I collected that data from 1995 through 2015. That law school entry data was linked to the July bar examination data three years later when those entrants would likely have taken the bar examination—so that the 1995 data on LSATs administered and number of law school applicants, for instance, was aligned to the 1998 July bar examination data in the graphs. The MPRE data includes data from the March MPRE administration of the same year in which the July bar examination was taken, as well as data from the previous year’s August and November MPRE administrations (which were linked to the July bar examination data one year later and aligned as such in the graphs). I produced separate graphs for the law school entry data and the MPRE data, as well as separate graphs for each zeroing in on the time span of 2010 to 2018.
Law School Entry Indexes
Figure 2 shows the values for the law school entry indexes and the July MBE mean scaled scores arranged on the 0.0 to 1.0 kappa scale. (First-year enrollment was not included because it was closely tied to the number of applicants; it did not add meaning beyond the number of applicants and introduced unnecessary complexity to the graphs.) The July MBE curve during the 21-year period from 1998 to 2018 has four peaks. The first peak occurs in 2001 and is a one-year bump that is out of sync with both the number of applicants and the number of LSATs administered three years prior. The second peak is in 2008 and is the highest value in the 21-year period (when the MBE mean score reached 145.6). The applicant pool for the two previous years of July bar examinations had been at its highest level and was still at a historically high level for the July 2008 exam. The number of LSATs administered corresponding to these three July bar examinations was at relatively high levels as well. The third peak occurs in 2013, but scores had been relatively stable since 2011. The number of applicants corresponding to that year’s examination had also stabilized and risen to a peak as well. The corresponding number of LSATs administered had been rising for the past three years and reached a maximum in 2010 (the year corresponding to the July 2013 bar examination).
2014 and 2015 show the July MBE mean score and both law school entry indexes making precipitous drops. The applicant pool corresponding to those two years (i.e., the applicant pool for years 2011 and 2012) dropped by 10.7% and another 13.5%, respectively. The number of LSATs administered for years 2011 and 2012 (corresponding to the 2014 and 2015 July bar examination years) dropped by 9.6% and another 16.2%, respectively. The final July MBE mean peak occurs in 2017. The corresponding applicant numbers and LSATs administered three years prior were both still declining when the 2017 July MBE mean peak occurred. The July MBE mean score and both indexes bottomed out in July 2018.
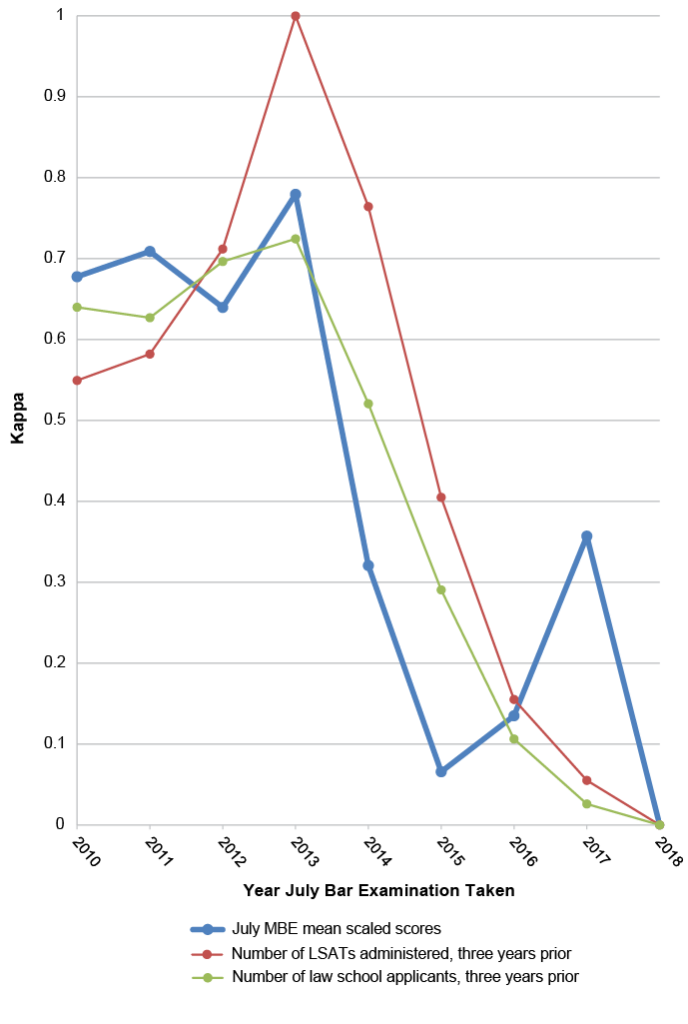
In looking at the overall trends, until 2008 the applicant kappa paralleled the July MBE kappa but trailed by 1–2 years. Beginning in 2008, the two curves were very similar except for 2016 and 2017 when the MBE kappa reversed trend and rose as both the applicant and LSAT kappas declined. The LSAT curve was at substantially lower levels in the trough period between 1998 and 2004 (i.e., LSATs administered between 1995 and 2001) and reached its highest levels in the period between 2012 and 2013 (i.e., LSATs administered between 2009 and 2010). (This rise in LSATs administered may have been boosted by a rise in the number of repeat LSAT takers during that period, as applicants became aware of new ABA criteria that went into effect in 2007 for schools reporting LSAT scores for admitted students. The new criteria required reporting the highest LSAT score earned by an examinee rather than the average of multiple LSAT scores for an examinee.) All kappas bottomed out in July 2018. The July MBE upward trend in 2016 and 2017 was opposite the continuing downward trend of the kappas for both applicants and LSATs administered. Figure 3 shows the same data but focuses on the period between 2010 and 2018. The recent trend can be seen in higher relief.
Figure 2: Kappa Conversions of Law School Entry Indexes and July MBE Mean Scaled Scores, 1998–2018
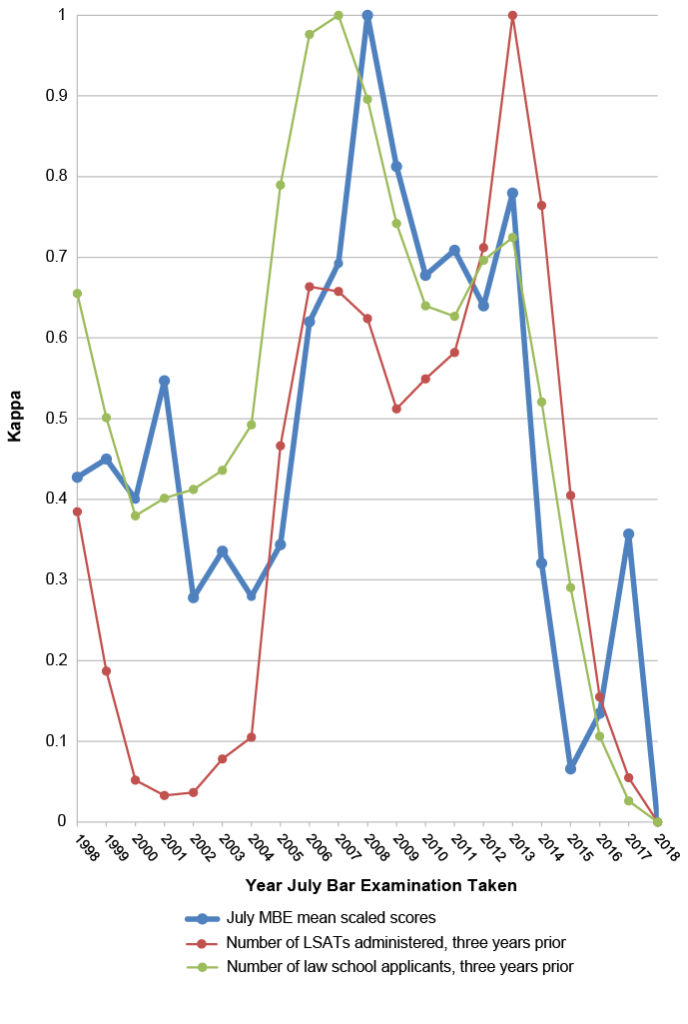
Figure 3: Kappa Conversions of Law School Entry Indexes and July MBE Mean Scaled Scores, 2010–2018
MPRE Administrations
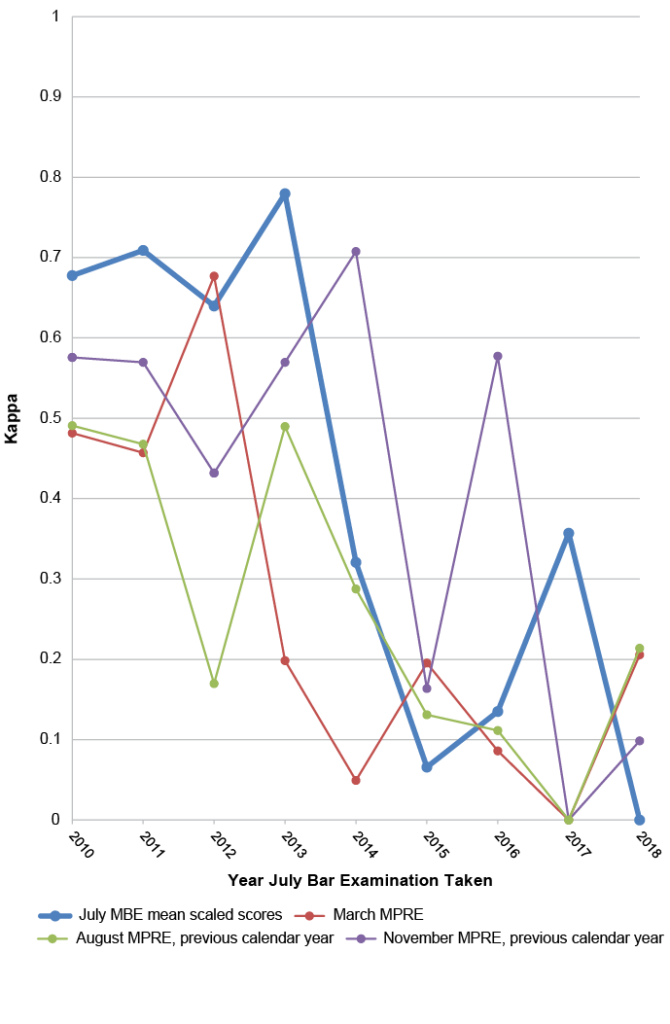
Figure 4 shows kappa values for the three MPRE administrations per year (March of the same year as the July bar examination, and August and November of the previous year) with the July MBE values for comparison. Unlike the July MBE, the MPRE kappas were at their highest levels in the period before 2006. Between 1998 and 2001, the MPRE kappas were closely packed and on a somewhat negative trajectory. In the first trough period of the MBE kappas between 2002 and 2005, the MPRE kappas stabilized, and while the August means were at their highest levels, the March and November means hovered between the midpoint and about three-quarters of their range.
After the peak of the MBE mean in 2008, the general trend of the MPRE scores was relentlessly downward. Most noticeable is that between 2012 and 2016, the spread of MPRE mean scores across the three administrations was substantially larger than in the other years. MPRE kappas bottomed out for all three administrations in 2017, one year before the July MBE, the number of applicants, and the number of LSATs administered bottomed out. Overall, the MPRE had a consistent negative trend since 2008. Figure 5 shows the same data for the period between 2010 and 2018 to provide higher relief for the most recent trend.
What is of most interest is that in the period where the July MBE rebounded in 2016 and 2017, only the November MPRE kappa for 2016 increased (representing the MPRE mean score from November 2015). The March and August MPRE kappas declined in 2016, and in 2017 all three MPRE kappas reached their lowest levels in the 21-year period since 1998.
Figure 4: Kappa Conversions of MPRE and July MBE Mean Scaled Scores, 1998–2018

Figure 5: Kappa Conversions of MPRE and July MBE Mean Scaled Scores, 2010–2018
February MBE Mean Scaled Scores
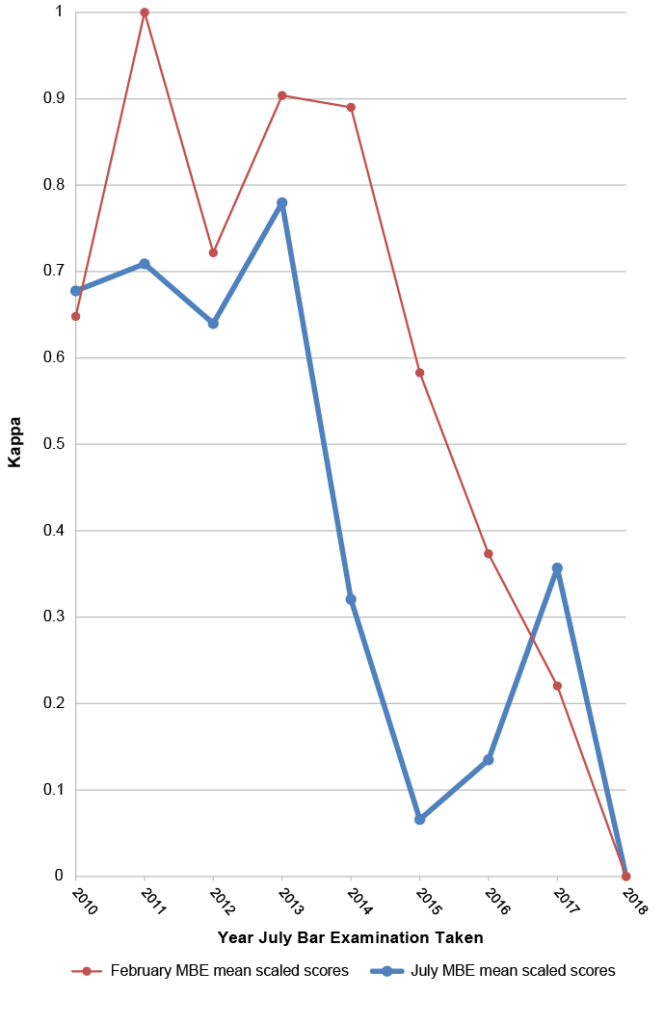
As an added point of interest, Figure 6 shows kappa values for the February MBE mean scores with the July MBE mean scores for comparison for years 1998–2018. Figure 7 shows the same data focusing on the period between 2010 and 2018. What is most noticeable is that between 2005 and 2013 the February MBE kappa was extremely erratic, showing a difference in the same direction no more than two administrations in a row. In 2013 and 2014, the February MBE had almost identical means at near record-high values before falling off the cliff in 2015. The fact that the free fall in February mean scores lagged that of the July mean scores by a year (actually seven months) is not surprising, since the February examinee population includes a high proportion of examinees who failed the examination the previous July, so the proficiency of the examinees in February reflects to some degree the proficiency of the previous July’s examinee population.
Somewhat perplexing is that the February MBE mean scores did not show the rise in 2017 and 2018 that the July mean scores experienced the two previous years. The February examinee population for 2017, for instance, which would have included repeaters who had failed the July 2016 examination and who reflected to some degree the proficiency of those July 2016 examinees, had mean scores that were still declining. Similarly, the 1.4-point rise in MBE mean scores in July 2017 would have been expected to work its way to the February 2018 MBE mean, but instead, the February 2018 mean reached its lowest point ever.
Figure 6: Kappa Conversions of February and July MBE Mean Scaled Scores, 1998–2018
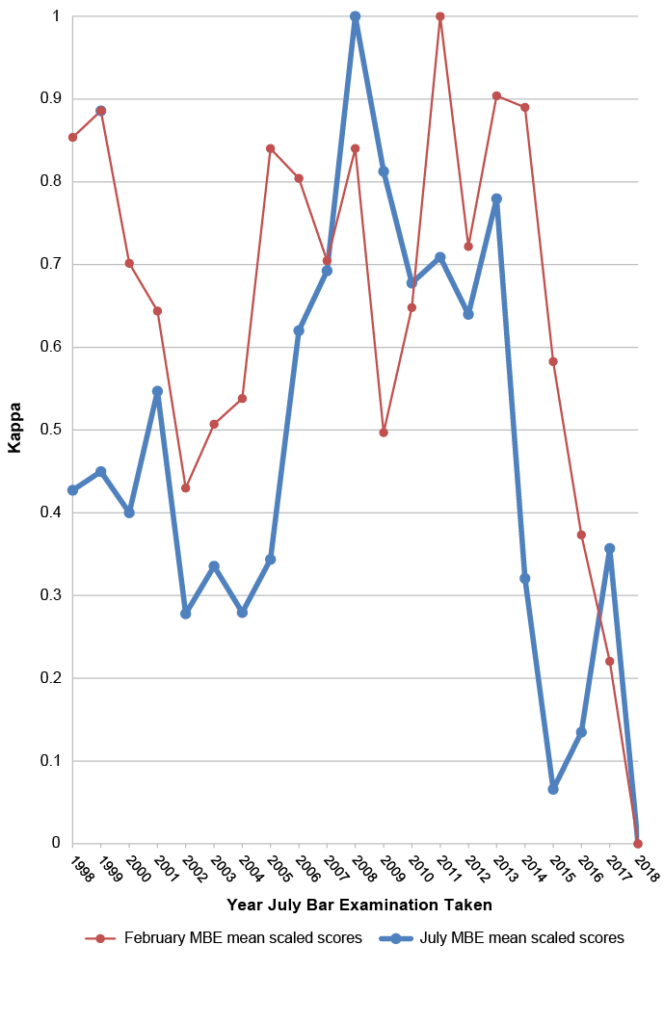
Figure 7: Kappa Conversions of February and July MBE Mean Scaled Scores, 2010–2018
Implications
So, what does all this mean? In trying to make some sense out of these trends, I put the data into a regression equation. A regression equation is basically a statistical tool for making sense out of complex data. Regression equations use a set of predictor variables to make predictions—in this case, I used the predictor variables of LSAT scores, MPRE scores, and February MBE scores to predict the MBE scores in July. The bottom line is that the rise in July MBE scores in 2016 and 2017 was not predicted by the regression equation. This is consistent with the trends observed in the declines in both the law school applicant pools and LSATs taken in the years those examinees were admitted to law school; in the negative MPRE trends for this group while in law school; and in the declines in MBE scores for the following February examinations, which were heavily populated by the examinees who had failed in July and were repeating the examination in February.
The next question that comes to mind is, why did the July MBE mean scores rise in 2016 and 2017 if the predictors all pointed in the other direction? We really do not have enough information to do more than speculate. I suspect that law schools and/or bar preparation companies may have been providing better guidance to students as to their readiness to take the bar examination during this period, but students who delayed taking the exam to better prepare could not delay indefinitely, and 2018 could have been the limit for many of them. It is possible that employers provide a window during which new lawyers must pass the bar exam, and 2018 just happened to be when the most at-risk examinees sat for the exam. It is also possible that with scores rising for the previous two July examinations, complacency might have set in with some examinees, and they didn’t study as much as those previous examinees. However, this is all speculation, and I will leave it to those with closer ties to law school students to go beyond these thoughts.
What Does the Future Hold?
Predicting the future is a tough proposition, particularly when the indicators are mixed. As shown in Figure 1, the 25th percentile LSAT scores continued to decline in 2016, which suggests that we may experience another year of declines in MBE mean scores. MPRE mean scores were more promising, as they were up from the previous year for all three administrations from August 2017 through March 2018. Unfortunately, the August 2018 MPRE mean was down from that in August 2017 by 0.7 points from 93.7 to 93.0. Conversely, the number of LSATs taken and the number of applicants to law school were up in 2016 and 2017, both harbingers of good things to come. Clearly, the signals are mixed. When faced with mixed signals, statistics can help sort out what is signal and what is just random noise.
While some may hold to the complaint popularized by Mark Twain that “there are three kinds of lies: lies, damned lies, and statistics,” statistics are based on data, and they need good data and lots of it if Mark Twain’s complaint is not to be realized. Regression equations are data hungry.
So, if you haven’t guessed it yet, one of the reasons I went back 20+ years for the data I am presenting is to enable development of the regression equation I described earlier. After using the equation to determine whether the increase in MBE mean scores in July 2016 and 2017 would have been predicted (which, as it turns out, it wasn’t), I turned to predicting the mean MBE score in July 2019. While my intention is not to predict an actual score, I can say that the results were a little promising in that the July 2019 MBE mean, according to the regression equation, is not predicted to decline further. I didn’t model February results, but if the current trend continues where the February bar examination is taken predominantly by repeat takers who failed in July and first-time takers who may have experienced academic challenges, the February MBE performance is likely to continue to parallel the 25th percentile LSAT performance of the entering classes. If that is the case, the data shown in Figure 1 would predict that the February MBE mean scores may continue to decline for the next year or two, even as the July MBE mean scores stabilize or make slight gains.
Conclusions
Based on available data for the students who graduated from law school in spring 2018, the decline in the July 2018 MBE mean scores was consistent with information on their law school entry indicators and performance on the MPRE. The rise in July MBE scores in 2016 and 2017, however, would not have been expected from these data. The indicators for the future are mixed but cautiously optimistic for July 2019. The indicators for February 2019, however, are fairly grim. In any case, whatever the future holds, the year 2019 should be interesting as I learn whether my statistics prove to be true or whether Mark Twain succeeds in taunting me from the great beyond.
Notes
- Mark A. Albanese, Ph.D., “The Testing Column: February 2018: The MBE Storm Surge Continues,” 87(2) The Bar Examiner (Summer 2018) 27–32.(Go back)
- As I mentioned in my Summer 2018 column, the repeater data presented in this article are based on an examinee having previously taken the MBE in any jurisdiction. This differs from the repeater data presented in the annual statistics published in the Bar Examiner, which is obtained from the jurisdictions and is based on an examinee having previously taken the bar examination in the reporting jurisdiction only. The MBE repeater data are available to NCBE through the NCBE Number that is required for MPRE registration, which NCBE is able to match to the NCBE Numbers reported on MBE answer sheets for jurisdictions that use the NCBE Number as a unique identifier (currently 49 of the 54 jurisdictions that administer the MBE, reflecting over 90% of MBE examinees).(Go back)

Contact us to request a pdf file of the original article as it appeared in the print edition.