This article originally appeared in The Bar Examiner print edition, December 2014 (Vol. 83, No. 4), pp. 50–56.
By Mark A. Albanese, PhDIf you set out to scale something, most people think of fish or mountains. In the somewhat warped world of psychometricians, however, we immediately think of examination scores and putting them on a scale that has meaning to the people who use the scores. Scaling is something that NCBE does for all of its examinations. There is one type of scaling we recommend, however, that has created some challenges for jurisdictions to understand why and how it is done and what effect it has on the scores: scaling the written portion of the bar examination to the MBE. We not only recommend that jurisdictions scale their written scores to the MBE, but we will do it for them if they wish.
The purpose of this article is to describe why and how we scale the written scores and then what effect scaling has on the scores that result. (In this article I use the terms “written scores” and “essay scores” interchangeably; the term “essay questions” should be interpreted to include performance tests, including the MPT.)
Why Scale the Written Scores to the MBE
Scaling the written scores to the MBE takes advantage of the equating done to MBE scores so that MBE scores have a constant interpretation across test administrations. If NCBE did not equate MBE scores, the percentage of examinees below any given score would vary unpredictably with the particular items used on the examination and with the proficiency of the examinees who take the test at a given administration. This could give jurisdictions problems in setting their passing scores. The percentage of examinees who fail at any given score could vary by a significant amount in unpredictable ways, or scores could remain constant at each administration, even though there might be known differences in proficiency in the candidate population.
Scaling to the MBE does not mean that the failure rate at a given passing score will be the same at all administrations. What it does mean is that the percentage passing at a given time is attributable to the performance on the examination, not to the relative ability of the group taking the test or to the particular test items used at that administration. Where this becomes especially important is in comparing results from the February and July administrations. The February administration generally has much lower scaled scores than the July administration. This is a pattern that has been found since the MBE was first administered in 1972 and is not unexpected. The July administration is in sync with law school graduation and examinees who are taking the MBE for the first time. February examinees, however, disproportionately tend to be those who failed the examination in July and those who are off-cycle because of academic challenges, among other reasons. The fact that the scaled scores are lower in February than in July is then something that would be expected in the natural order of things.
How We Scale the Written Scores to the MBE
Former NCBE Director of Testing Susan M. Case, Ph.D., describes how scores are scaled to the MBE in her 2005 Bar Examiner article, “Demystifying Scaling to the MBE: How’d You Do That?”1 I am going to take a different approach by continuing with the house-hunting analogy that I used in my September 2014 column in which I described how to interpret the mean and standard deviation.2
As I said in that article, when buying a house, the adage goes: the three most important things are location, location, location. When talking about test scores, the mean score is the most common index of the location of a group of scores.
After location, the other important factor relates to the spread or layout of the property—such as the lot size, interior square footage of finished space, number of bathrooms, and so on. The standard deviation (SD) is the most commonly used index of the spread of scores and can be thought of as representing the typical deviation of scores from the mean.
Because location and spread are critical elements in any score distribution, the scaling of the written scores to the MBE must have these two elements addressed. The formula below shows how scaled essay scores are produced and how the parts relate to location and spread.
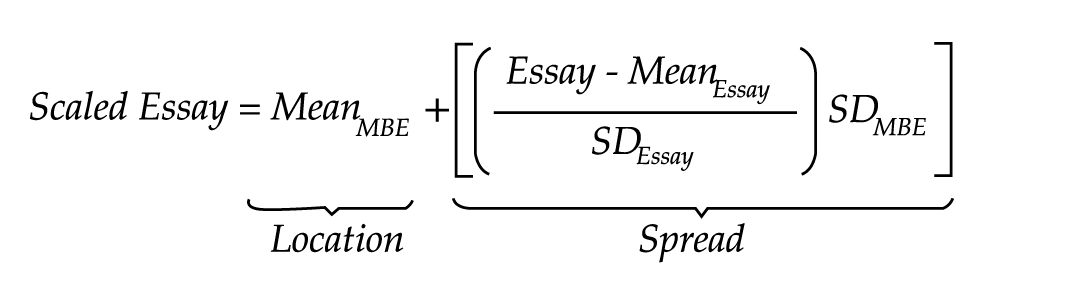
The location component of the formula gives the mean score of the written portion the same mean as the MBE scores in that jurisdiction. The spread component of the formula gives the written portion the same SD as the MBE. So, scaling essay scores to the MBE gives them the same location and spread as the MBE. The range of scores (the difference between the high and low values) will be approximately the same as that of the MBE, but not exactly the same.
Start with MBE Scores
To provide a visual depiction of how the two parts of the formula work, Figure 1 begins by showing a bar graph of data from the MBE for a jurisdiction. This is the same figure that I used in my previous article, so you may already be familiar with it. The scores along the horizontal axis are the scaled MBE scores. Each bar covers 8 scaled score points (e.g., the first bar on the left covers the scaled score range from 96 to 104). The height of the bar indicates the percentage of examinees who had scores in the MBE scaled score range along the bottom of the bar. So, going to the fourth bar from the left, the MBE scaled scores covered by that bar are centered at 124 but range from 120 to 128 and were achieved by approximately 15% of the examinees.
Figure 1: Location and spread of MBE scores from a jurisdiction
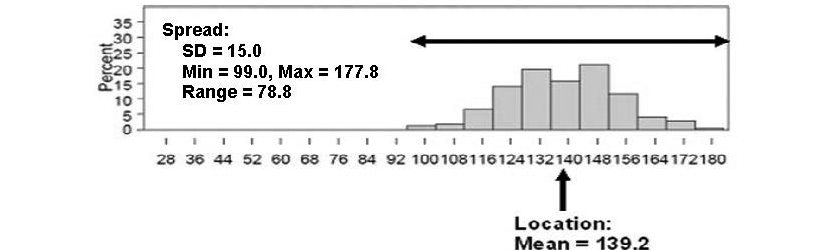
At the bottom of the figure, location is indicated, and it points to the mean of the distribution at 139.2. At the top of the figure, spread of scores is indicated by the double-headed arrow delimiting the high and low values (approximately 178 and 99, respectively) and the SD value of 15.0. The range of scores representing the high and low values, and the SD, which represents the average deviation from the mean, are both ways of characterizing the spread of scores across the scale. Unless there are extreme scores, +/– 3 SD will cover the range of scores. (139.2 – (3 x 15 = 45) = 94.2 and 139.2 + (3 x 15 = 45) = 184.2, values that cover the entire range of scores in the distribution.) The fact that +/– 3 SD will usually cover the range of scores is sometimes referred to as 6 sigma, since sigma is an alternative term used for the SD.3
Add the Written Scores
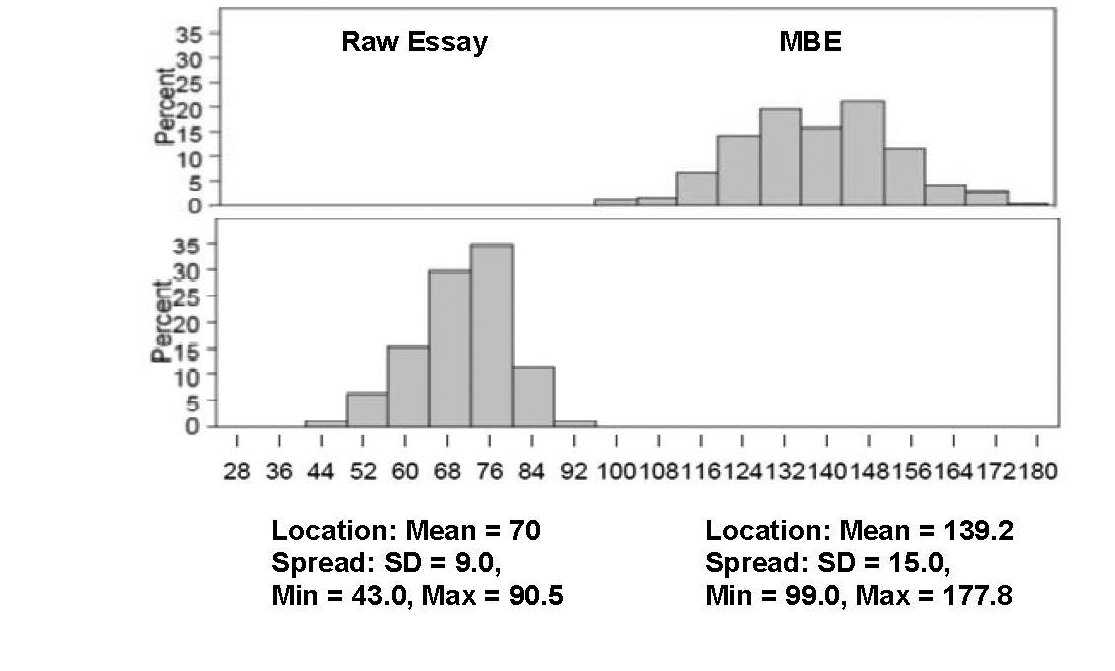
The next step is to add the written scores to the graph showing the distribution of MBE scores. Figure 2 adds the distribution of the raw essay scores on the bottom left along with the MBE scores included on the upper right. Because there will be overlap in the distributions as we go through the scaling process, they are shown in separate boxes but with the same values on the horizontal axis. The MBE score distribution is identical to that shown in Figure 1. The raw essay scores range from 43.0 to 90.5, and the MBE scores range from 99.0 to 177.8, so there is no overlap in the distributions.
Figure 2: MBE + raw essay scores
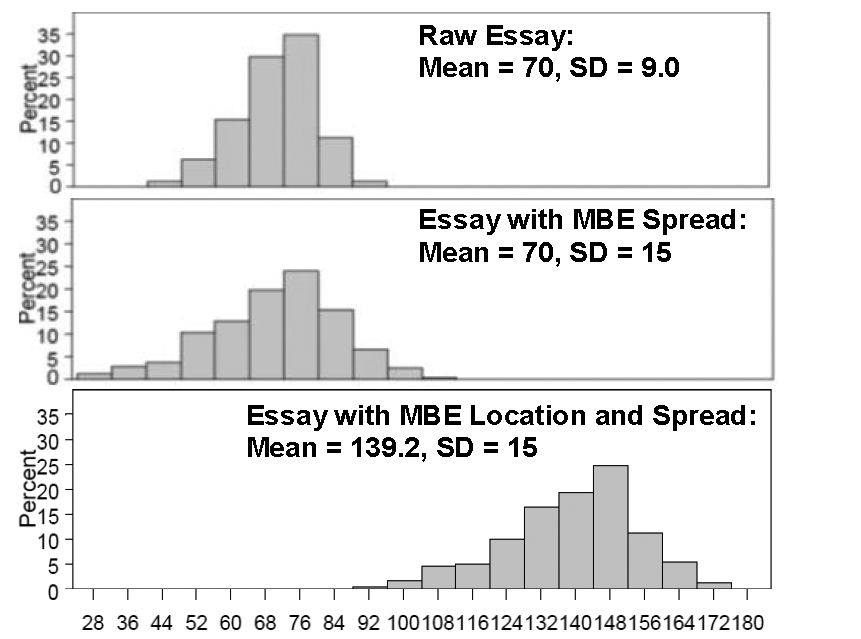
The first thing the scaling formula does is to give the raw essay scores the same SD as the MBE scores. Figure 3 shows the original raw essay score distribution with SD = 9.0 on the top while the bottom shows what it looks like after giving it the MBE SD = 15.0. Note that the distribution of essay scores has been expanded: the minimum value decreased from 43.0 to 24.8, and the maximum value increased from 90.5 to 104.4. In spite of the increase in the range of scores from the original 47.5 (90.5 – 43.0) to 79.6 (104.4 – 24.8), the mean has remained unchanged at 70.
Figure 3: Making the spread of the raw essay scores and MBE scores the same (SD = 15)

Figure 4 shows a composite of the three steps the essay scores go through to become scaled to the MBE. The upper panel shows the original distribution of the essay scores, the middle panel shows the essay scores after they are given the same SD as the MBE scores, and, finally, the bottom panel shows the final product where essay scores are scaled to the MBE. So, that is how we scale the written portion of the bar examination to the MBE.
Figure 4: Moving the essay scores with SD = 15 to the same location as the MBE (mean = 139.2)
The Effect of Scaling on the Written Scores That Result
To assist with the discussion of what scaling the written scores to the MBE does to the scores that result, Figure 5 juxtaposes the original MBE score distribution (upper panel) and the essay scores scaled to the MBE (bottom panel). You can see from Figure 5 that the MBE score distribution and the essay scores scaled to the MBE have the same mean and SD, but not the same shape. The essay scores retain the shape of their original distribution after they are scaled to the MBE, although the shape may appear to be elongated or stretched out along the horizontal axis after being given the larger SD of the MBE. If the SD of the MBE had been smaller than that of the essay scores, the distribution would look more crowded but still have the same basic shape.
Figure 5: MBE scores and essay scores scaled to the MBE (mean = 139.2, SD = 15)

In addition to having a mean and an SD identical to those of the MBE, the scaled essay scores’ minimum and maximum values and their difference, the range, are more similar, but not identical, to those of the MBE. Unlike the SD, scaling to the MBE does not make the minimum and maximum values of the scaled essay scores identical to those of the MBE. But the examinee who received the lowest score on the raw essay score distribution will have the lowest score on the scaled essay score distribution. The same is true for the examinee who received the highest score. Scaling to the MBE leaves the relative ordering of the examinees intact from what it is on the raw essay score distribution.
Stability of Scores
Because MBE scores are equated, whereby they have comparable meaning across different administrations, scaling the essay scores to the MBE gives the essay scores the same stability. Thus, if the essay questions given at one administration are substantially more difficult than those administered at another time, it will not affect the mean and SD of the scaled essay scores. While the intrinsic difficulty of different essay questions may affect which examinees perform better than others, scaling to the MBE will not. The average scaled essay score will have the mean of the MBE scores in the jurisdiction no matter how intrinsically difficult the essay questions may be in comparison with past administrations. If Joe has the lowest raw essay score, he will have the lowest scaled essay score. If there are 50 examinees who had lower scores than Joe on the raw essay score distribution, the same 50 examinees will have lower scores than Joe on the scaled essay score distribution. At the individual score level in comparison to nearest neighbors, scaling to the MBE moves all examinees to the same new neighborhood (mean score) and then modifies how far apart they are. The relative position of each examinee is not changed.
Passing Rates
The stabilizing effect of scaling essay scores to the MBE will have the most impact on passing rates. Assuming equal weighting of the MBE and written scores, the percentage of examinees who pass the written portion will generally be no less than the percentage who would pass the MBE if it were used alone. (For example, suppose a jurisdiction used the sum of the scaled written score and the scaled MBE score with a total passing score of 270. If 90% of the examinees had MBE scores higher than 135, at least 90% of the examinees would be expected to have the sum of their MBE and scaled written scores to be above 270.) While combining the scaled essay scores with the MBE scores will not have an impact on the percentage of examinees who fail, the particular examinees who fail will be different from those who would fail strictly from the MBE alone. The written score will have an impact on who passes proportionate to its weight, which varies between jurisdictions. (For jurisdictions that have adopted the Uniform Bar Examination, the weight given to the MBE and the written portion is set at 50–50.)
Summary
I will close by summarizing what scaling essay scores to the MBE will and will not do.
Scaling essay scores to the MBE will
- give the scaled essay scores the same mean and SD as the MBE in the jurisdiction;
- give the scaled essay scores the same approximate high and low values as well as scores in between, enabling familiarity with the MBE score scale to carry over for setting passing scores and other purposes;
- stabilize passing rates even though the intrinsic difficulty of essay questions may vary;
- control for differences in examinee proficiency across administrations, most notably between July and February administrations; and
- maintain a constant standard in the event examinee proficiency should either increase or decrease from historical levels.4
Scaling essay scores to the MBE will NOT
- change the order in which examinees are ranked from that on the raw essay score distribution;
- make up for graders who are poorly trained or who do not apply the grading guidelines adequately; or
- make up for essay questions that are confusing or are otherwise poorly written.
If the jurisdictions do their job of maintaining high-quality test administration and essay grading procedures, we will do our job of helping them ensure that their standards are maintained.
Notes
- Susan M. Case, Ph.D., “The Testing Column: Demystifying Scaling to the MBE: How’d You Do That?” 74(2) The Bar Examiner 45–46 (May 2005). (Go back)
- Mark A. Albanese, Ph.D., “The Testing Column: What Does the Mean Mean and How Standard Is That Deviation?” 83(3) The Bar Examiner 37–45 (September 2014). (Go back)
- Note that the width of the bars is an arbitrary choice; usually, a statistical program will choose the width of the bars such that there are 10 or 11 bars. The tick marks on the bottom and left side of the graph are also set at arbitrary distances by statistical programs to cover the range of scores, with maximum and minimum values being covered and with the 0 value also included, unless the minimum score is too far from 0 to be included without major scale distortion. (Go back)
- We have seen the first signs of the decline in applicants to law school in the July 2014 results, where the mean scaled MBE scores declined by 2.8 points nationally. The vast majority of newly graduating examinees taking the bar examination in 2014 were those who entered law school three years earlier in 2011. The applicant pool in 2011 was 78,500, compared to 87,900 in 2010, a drop of 10.7%. In 2012 and 2013, there were further declines to 67,900 (13.5% drop from 2011) and 59,400 (12.5% drop from 2012), respectively. To the extent that a decline in the applicant pool translates to bar examinees who are less proficient, the reduction in MBE scores is likely to continue. The counter to this trend is that the first-year law school enrollment also declined by 8.7% and 10.8% in 2012 and 2013, respectively, so law schools have cut their enrollment in response to having too few applicants who meet their standards. The success of these counterefforts may be reflected in the fact that the mean LSAT scores of first-year law school enrollees have remained relatively constant, declining by less than 2 points over this period. (Source: ABA Section of Legal Education and Admissions to the Bar, Statistics, http://www.americanbar.org/groups/legal_education/resources/statistics.html [last visited Oct. 14, 2014].) (Go back)
 Mark A. Albanese, PhD, is the Director of Testing and Research for the National Conference of Bar Examiners.
Contact us to request a pdf file of the original article as it appeared in the print edition.