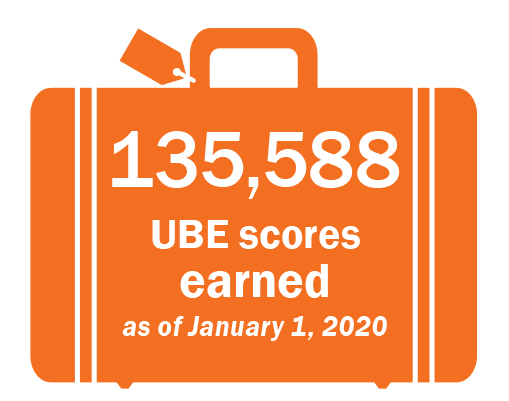
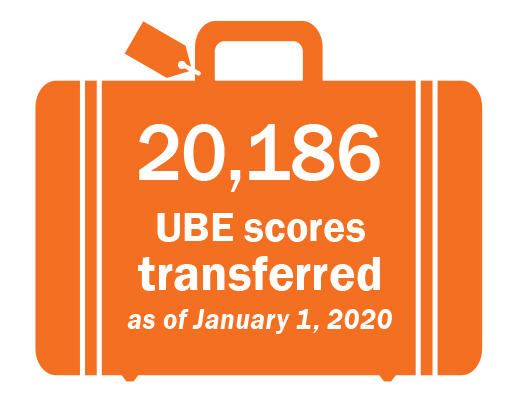
UBE Scores Earned and Transferred
as of January 1, 2020
Number of UBE Scores Earned by Year
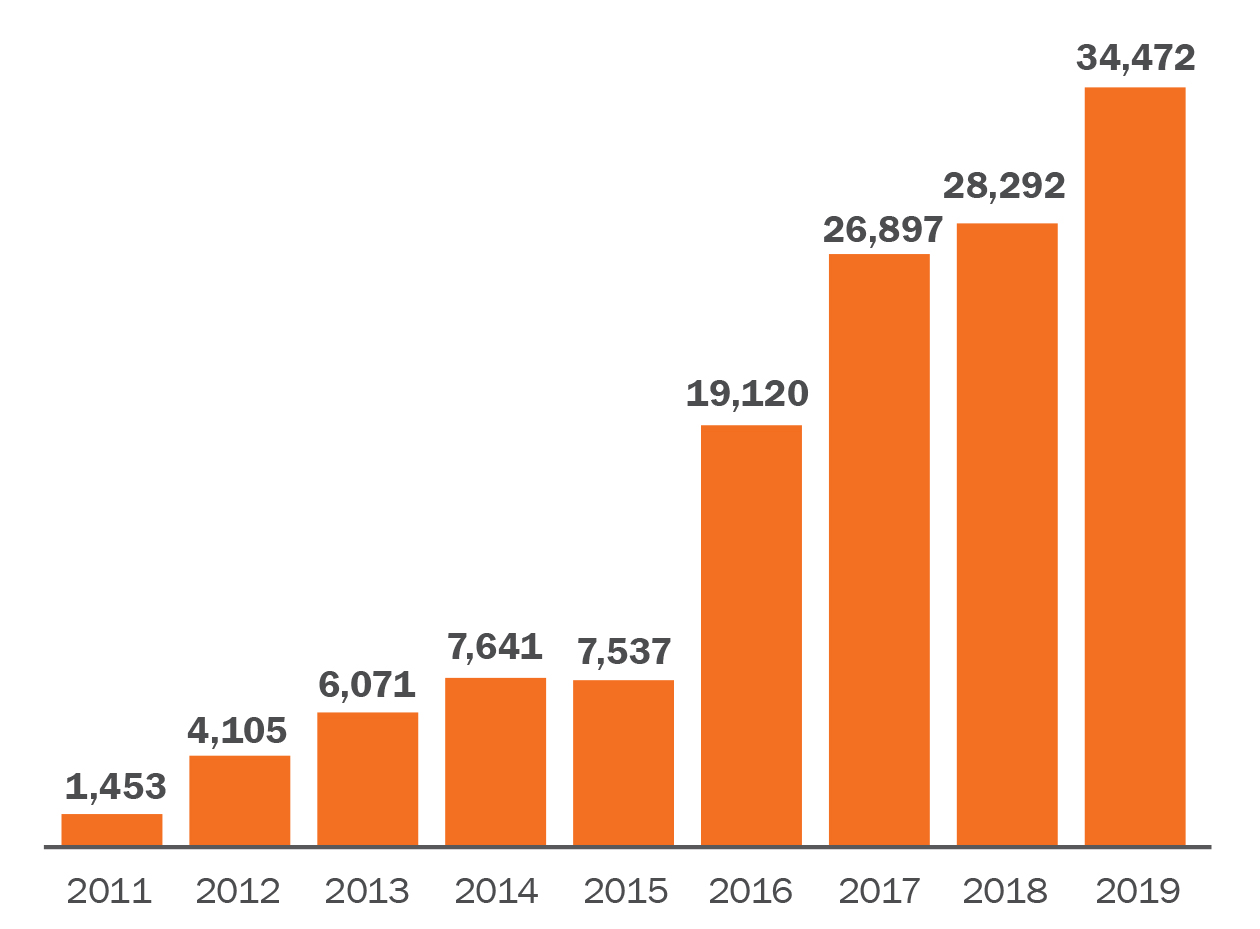
The Uniform Bar Examination results in a portable score that can be used to apply for admission in other UBE jurisdictions.
November 2019 MPRE
22,165 November 2019 MPRE Examinees
Number of MPRE Examinees 2015–2019

November 2019 MPRE Mean Score 97.0 (score scale 50–150)
MPRE Mean Scores 2015–2019

MPRE Standard Deviations
|
|
March |
August |
November |
|
2015 |
17.4 |
16.9 |
17.5 |
|
2016 |
17.6 |
17.7 |
17.3 |
|
2017 |
17.1 |
18.0 |
17.4 |
|
2018 |
17.9 |
17.8 |
18.2 |
|
2019 |
17.9 |
17.5 |
18.3 |
MPRE scores are reported on a scale ranging from 50 to 150. The values reflect valid scores available electronically as of 1/24/20 on both standard and alternative forms of the MPRE.
NCBE’s Character and Fitness Investigation Services in 2019
 Investigation Services
NCBE provides investigation services to support jurisdiction character and fitness requirements for law student registration, bar examination, UBE transfer, motion, in-house counsel, and foreign legal consultant applications.
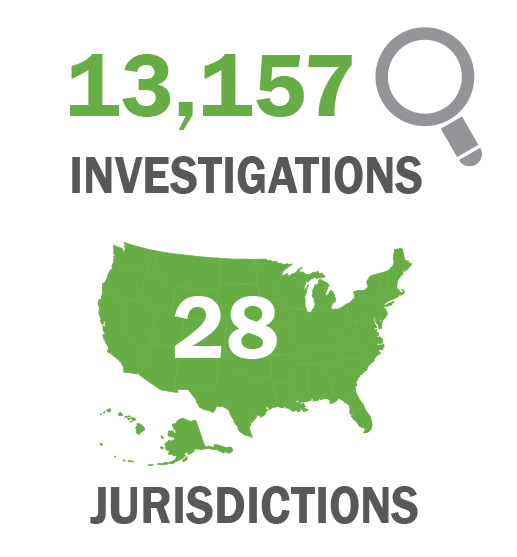
NCBE conducted 13,157 character and fitness investigations on behalf of 28 jurisdictions in 2019.
 Online Character Report Application
NCBE also offers an online character report application that jurisdictions may use in conjunction with our investigation services or independently.
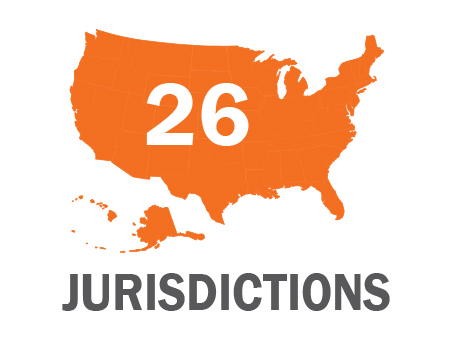
26 jurisdictions used our online character report application in 2019.
 Online Verification Process
Our Online Verification process allows jurisdictions and law schools to electronically receive and respond to NCBE’s investigation inquiries related to information reported by applicants in their character report applications.
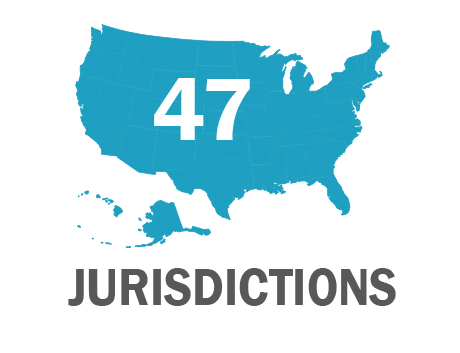
47 jurisdictions used our Online Verification process in 2019.
 Cross-Reference Service
Our Cross-Reference service is a tool offered to jurisdictions to investigate whether applicants have previously submitted any type of application to another jurisdiction.
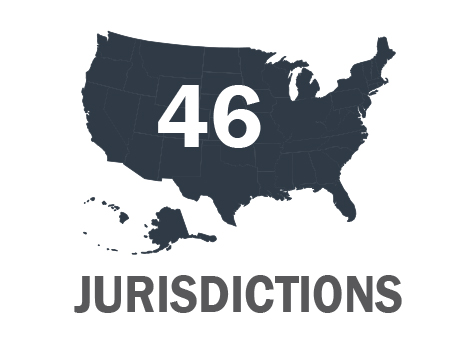
46 jurisdictions participated in our Cross-Reference service in 2019.
 Testing Task Force Practice Analysis Survey Respondents
14,846 people completed the practice analysis survey.
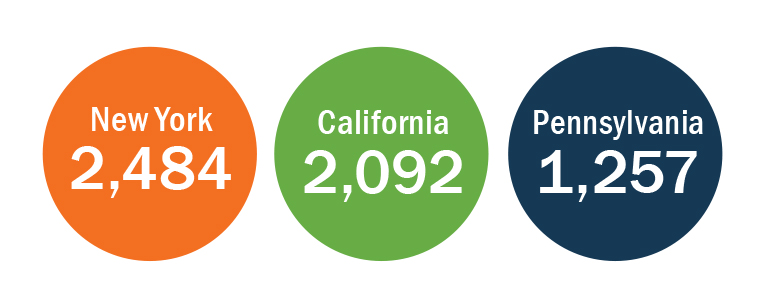
The 3 jurisdictions with the greatest numbers of respondents were
- New York 2,484
- California 2,092
- Pennsylvania 1,257
See the chart in the Testing Task Force Quarterly Update in this issue for a complete list of survey respondents by jurisdiction.

