This article originally appeared in The Bar Examiner print edition, Winter 2017-2018 (Vol. 86, No. 4), pp 8–16.
By James G. Leipold and Judith N. Collins

It has been 10 years since the beginning of the Great Recession in December 2007, and the legal employment market for new law school graduates is very different from what it was before the recession. Fortunately, over the last three years, overall graduate employment has improved. It is a much stronger job market than it was in the aftermath of the recession, with the graduating classes of 2011, 2012, and 2013 having arguably faced the most difficult job markets of any graduating classes since the early 1990s. Nonetheless, the job market remains much less robust than the heady market that greeted the classes of 2006 and 2007 during the boom years that preceded the crash.
The Big Picture
A few broad strokes can succinctly describe the new market. First, there are fewer private practice opportunities for law school graduates than there were before the recession. Partly because of that, a higher percentage of graduates are taking “law-related” jobs. Also referred to as “J.D.-advantage” jobs, these are jobs for which a J.D. provides an advantage in obtaining the job, or may even be required, but for which bar passage is not required. Some of these law-related jobs, typically in business and industry, are new or emerging job opportunities that did not exist before the recession. This loss of private practice opportunities replaced in part by law-related jobs is mostly where the disruption has occurred following the recession. Now, 10 years after the start of the recession, the pendulum is beginning to swing the other way. As the percentage of jobs in private practice is on the rise again, the percentage of jobs taken in business and industry is declining. Nonetheless, jobs in business remain near historic highs, and within business, J.D.-advantage jobs make up a growing portion of those jobs.
Second, other employment sectors, like government (including military), public interest, and the judicial clerkship market, which were steady sources of legal jobs before and during the recession, remain so after the recession. These sectors are much more impervious to cycles of economic boom and bust and have been much less interrupted by the forces of technology and globalization that have rocked private practice, particularly in the large-firm setting, over the last 10 years.
Finally, the unemployment rate for new law school graduates 10 months after graduation remains higher than it was before the recession, though it has come down slowly over the last three years as a higher percentage of recent graduates have found jobs.
A Few Vexing Numbers
Beginning with the class of 2008, the overall employment rate for new law school graduates declined for six years in a row, even as the national and legal economies recovered. That rate has only begun to improve over the last three years. The overall employment rate for the class of 2016, the most recent class for which complete employment data is available, was up by almost one full percentage point from the previous year, to 87.5 percent of graduates for whom employment status was known, compared with 86.7 percent for the class of 2015 (see Figure 1).
For members of the class of 2016, however, the single most significant factor that defined their employment prospects was their small class size, which was more than 20 percent smaller than the class of 2013, the largest law school class ever to graduate. At 37,124, the class of 2016 had nearly 10,000 fewer members than the 46,776 law students who graduated as the class of 2013. This smaller class, however, while achieving a higher employment rate than any class since the class of 2010, secured the smallest overall number of jobs of any class since the class of 2001 and, significantly, the smallest number of private practice jobs of any class since the class of 1996.
Figure 1: Law graduate employment rate 9/10* months after graduation, 1999–2016

* Beginning with the class of 2014, employment status information was collected as of March 15 (i.e., 10 months after graduation), rather than February 15 (i.e., 9 months after graduation), as it had been in prior years. The orange and blue bars denote this shift in reporting methods. The figures for the classes of 2014–2016 are therefore not directly comparable with the employment rates for the classes that immediately preceded them.
Source: NALP, Jobs & JDs: Employment and Salaries of New Law Graduates, classes of 1999–2016.
As the number of jobs grew following the recession, the size of the class grew more quickly, and the unemployment rate continued to rise; as the number of jobs has come down over the last three years, the size of the graduating class has come down more quickly, allowing the employment rate to rise.
The overall employment rate is thus a reflection of both the number of opportunities available and the changing gap between supply and demand. As the number of jobs grew following the recession, the size of the class grew more quickly, and the unemployment rate continued to rise; as the number of jobs has come down over the last three years, the size of the graduating class has come down more quickly, allowing the employment rate to rise (see Figure 2).
The reason for the shrinking number of jobs obtained is not exactly clear. Of course, a smaller class could be expected to secure a smaller number of jobs; however, it is also the case that at other points in time NALP has documented employment figures for classes that shrank in size but still secured more jobs than the larger classes that preceded them. For instance, as recently as 2007, the class size went down and the number of jobs obtained went up, as seen in Figure 2. So, we can say with some confidence that the data do not describe a job market for new law school graduates that is expanding. Private practice opportunities, the backbone of the job market for new law school graduates, collapsed in 2010 when, as a percentage of all jobs, they shrank by five percentage points in a single year. Since then, they have partially bounced back, but only jobs at the largest law firms have grown measurably in the last several years.
Figure 2: Total number of jobs obtained vs. graduating class size, 2006–2016

Sources: All jobs figures come from NALP, Jobs & JDs: Employment and Salaries of New Law Graduates, classes of 2006–2016. Class size figures come from the ABA Section of Legal Education and Admissions to the Bar (see https://www.americanbar.org/groups/legal_education/resources/statistics.html).
The smaller number of jobs obtained by the class of 2016 is likely attributable to multiple factors, including a rapidly changing legal services market. Pressures from the in-house legal departments of client corporations to bring down the cost of outside legal services purchased; the advent of alternative legal services providers both domestically and abroad; and rapid advances being made with technology, including artificial intelligence, to automate and systematize routine legal tasks have all brought downward pressure on law firm lawyer head count.
As for the employment rate, it is unknown what effect the falling bar passage rate has had upon that rate, but that could certainly also play a role in the smaller number of jobs secured 10 months after graduation. As has been widely reported in the press, many jurisdictions experienced falling bar passage rates over a roughly three-year period, with the classes of 2014, 2015, and 2016. During this three-year period, the number of bar-passage-required jobs obtained went down in each year. (28,745 such jobs were reported for the class of 2013, prior to this three-year decline in bar passage rates; 27,928 such jobs were reported for the class of 2014; 25,712 such jobs were reported for the class of 2015; and only 24,243 such jobs were reported for the class of 2016.) Nonetheless, the percentage of graduates obtaining bar-passage-required jobs went up slightly for each of the classes of 2014, 2015, and 2016 because there were fewer graduates.
What the data do show is that for the third year in a row the actual number of jobs obtained went down in every sector except the largest law firms of more than 500 lawyers. Members of the class of 2016 secured just about 16,600 jobs in law firms of any size, down by more than 5,000 since the number of those jobs peaked for the class of 2007. And while the largest law firms hired more law school graduates than at any time since the recession, the number of entry-level jobs at those firms is still off by nearly 1,000 positions compared with the peak hiring measured with the class of 2008.
The findings on employment outcomes for members of the class of 2016 thus depict an entry-level legal employment market that continues to improve, albeit modestly. For the third year in a row the employment rate is shaped by a smaller number of available jobs and a smaller graduating class, with graduates benefitting from slightly less competition for the jobs that exist.
The Distribution of Law School Employment Outcomes
As shown in Figure 3, for the class of 2016, 67.7 percent of all graduates for whom employment status was known obtained a job for which bar passage is required, the accepted proxy for having a job practicing law. This is up from the 64.4 percent measured for the classes of 2012 and 2013, but still well off the level of 76.9 percent measured for the class of 2007.
Figure 3: Employment outcomes for the class of 2016: employment status of graduates
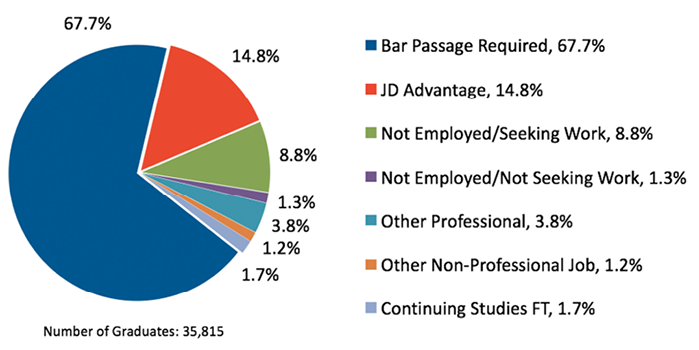
Note: Jobs for which an offer has been accepted but for which the start date is deferred, and jobs for which job type (e.g., bar passage required) was not specified, account for 0.69% and 0.04% of graduates, respectively, but are not shown on the chart; 96.5% of class of 2016 graduates from ABA-accredited law schools reported employment status.
Source: NALP, Jobs & JDs: Employment and Salaries of New Law Graduates, Class of 2016.
An additional 14.8 percent of graduates obtained J.D.-advantage jobs. Other than a small drop in 2015, which was totally recouped in 2016, that figure has increased steadily since 2007 and represents an area of real job growth for new graduates. These jobs include some new jobs in compliance, legal process outsourcing, and data privacy and security, among others, that have emerged as significant sources of law graduate employment since the recession.
The percentage of graduates employed in all other capacities, both professional and nonprofessional jobs, was 5.0 percent. The unemployment rate, counting both graduates still seeking a job and those not seeking, also edged down for this class and stood at 10.1 percent, compared with 10.9 percent for the class of 2015, but well above the 5.8 percent measured for the class of 2007. Of the remaining graduates for whom employment status was known, 0.69 percent had accepted a job as of March 15, 2017, but had not yet started that job, and 0.04 percent had accepted a job but did not specify the type of job. 1.7 percent of the 2016 graduates were continuing their academic studies full-time. Table 1 shows comparison data from 2007 to 2016 for each of these employment categories.
Table 1: Law Graduate Employment Status, 2007–2016
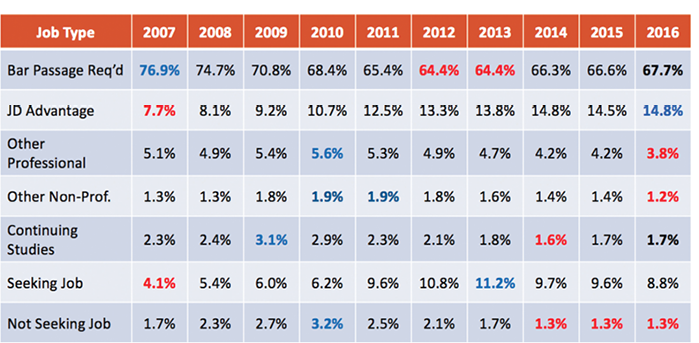
Note: The figures in blue indicate the highest data points for each category; the figures in red indicate the lowest data points.
Source: NALP, Jobs & JDs: Employment and Salaries of New Law Graduates, Classes of 2007–2016.
Leaving aside the graduates who were unemployed and those who were continuing their studies full-time, and counting just those graduates who held jobs 10 months after graduation, 77.3 percent were working in bar-passage-required jobs and 16.9 percent were working in J.D.-advantage jobs, with just 5.4 percent working in other professional and nonprofessional jobs. This means that more than 94 percent of those graduates who were employed 10 months after graduation were working in jobs that arguably used their law degree to some extent (see Figure 4).
Figure 4: Employment outcomes for the class of 2016: job types of those employed

Note: Jobs for which job type (e.g., bar passage required) was not specified account for 0.04% of jobs but are not shown on the chart.
Source: NALP, Jobs & JDs: Employment and Salaries of New Law Graduates, Class of 2016.
The Distribution of Jobs by Employer Type
Additional analyses of the jobs data for the class of 2016, as shown in Figure 5, reveal that over half (52.9 percent) of employed graduates obtained a job in private practice. The percentage of jobs in private practice has fluctuated in the narrow range of 50.7 percent to 52.9 percent of jobs in the past five years. Though there has been recovery since the percentage of private practice jobs dropped to a historic low of 49.5 percent for the class of 2011, there has not been a return to the 55.9 percent figure for the class of 2009. For most of the more than 40 years for which NALP has collected employment information, the percentage of private practice jobs has been in the 55–58 percent range and has been below 55 percent only before 1981 and since 2010.
Despite a somewhat higher percentage of jobs in private practice for the class of 2016 compared with recent years, the smaller number of jobs obtained overall for that class means that the number of law firm jobs actually decreased by about 3.2 percent from 2015. This reflects a percentage decrease considerably smaller than the 7.6 percent decrease from 2014 to 2015, and it is in line with that from 2013 to 2014, which was 3.5 percent. But it is nonetheless in contrast to a cumulative increase of about 9 percent in 2012 and 2013 after the low point in 2011.
Public service jobs, comprising military and other government jobs, judicial clerkships, and public interest positions, accounted for 29.5 percent of jobs taken by employed graduates of the class of 2016. This is essentially unchanged from 2015 and higher than the 28.7 percent in 2014, 27.6 percent in 2013, and 28.2 percent in 2012. Fluctuations in this figure notwithstanding, this percentage has remained relatively stable for more than 35 years, at 26–29 percent.
Figure 5: Employment outcomes for the class of 2016: employer type
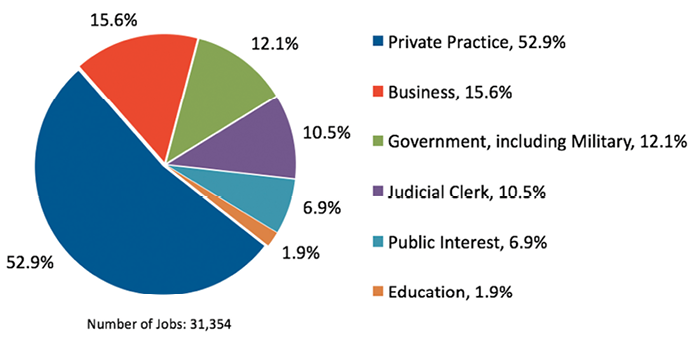
Note: The category for employer type unknown, accounting for 0.06% of jobs, is not shown.
Source: NALP, Jobs & JDs: Employment and Salaries of New Law Graduates, Class of 2016.
Public interest organizations, including public defenders, accounted for 6.9 percent of jobs held by class of 2016 graduates. This compares with figures in the 7.1 percent to 7.5 percent range from 2011 to 2015, 6.7 percent in 2010, and 5.6 percent in 2009. The increases are partly attributable to the emergence of law school programs providing fellowship and grant opportunities in a variety of settings, including public interest.
Although the percentage of judicial clerkship jobs has fluctuated somewhat since 2010, and stood at 10.5 percent in 2016, the number of clerkship opportunities has remained relatively steady since 2010, with between 3,300 and 3,400 jobs reported. Employment in government jobs, distributed between the federal, state, and local branches, stood at 12.1 percent for the class of 2016, a figure that has not varied much over the last 10 years.
Employment in business stood at 15.6 percent, down from 17.2 percent in 2015 and the third and largest decline since reaching a historic high of 18.4 percent in 2013. The share of jobs in business has exceeded 15 percent since 2010. About 24 percent of these jobs were reported as requiring bar passage, and about 52 percent were reported as jobs for which a J.D. was an advantage. As mentioned earlier, as the share of jobs in large law firms has slowly come back, the share of graduates working in business has decreased more or less proportionately.
About 6.3 percent of these business jobs represent graduates working for agencies that place individuals in temporary legal, law clerk, or paralegal jobs, similar to 6.6 percent for the class of 2015. The number of graduates taking these kinds of jobs has varied considerably since NALP began tracking this job category in 2006. The percentage for 2016 translates to just over 300 jobs, compared to about 380 for the class of 2015. These numbers are far below the 700 reached in 2011, and the 2016 number is the lowest recorded.
By contrast, jobs in education (jobs within all levels and all sectors of education, including administrative jobs such as those in admissions and career services and other full-time professional roles, and teaching jobs of any sort) more than doubled during the recession. The sharp rise in this job category was partly attributable to law schools having taken a very active role in employing their own graduates during the recession by providing research assistantships or other law-school-based temporary positions. The numbers for this job category are now back well below pre-recession levels. At 1.9 percent, there are fewer jobs in education than at any time since 2003. Table 2 shows comparison data from 2007 to 2016 for each of these employer types.
Table 2: Law Graduate Employer Type, 2007–2016

Note: The figures in blue indicate the highest data points for each category; the figures in red indicate the lowest data points.
Source: NALP, Jobs & JDs: Employment and Salaries of New Law Graduates, Classes of 2007–2016.
The New Balance
We have noted that as the percentage of private practice jobs shrinks, graduates tend to secure a higher percentage of jobs in business, and that as the percentage of jobs in private practice grows, the percentage of jobs taken in business tends to shrink. There is also a push-pull between jobs in the largest law firms and jobs in the smallest law firms, the two ends of private practice where the largest numbers of jobs for new law school graduates exist. (Almost 57 percent of private practice jobs for the class of 2016 were with firms of 50 lawyers or fewer, and nearly 26 percent were with firms of more than 500 lawyers. The rest were at firms that fall in between in terms of lawyer head count.)
NALP has documented over multiple cycles of economic growth and collapse that as large law firm opportunities shrink, more graduates secure jobs with the smallest firms. This is not because small firms thrive in times of economic strife. Rather, it is because the small-firm job market is more entrepreneurial in nature, and during a tougher job market, graduates tend to create more opportunities for themselves with small firms when jobs with larger firms are less available. For instance, by taking contract work to start, or by networking and volunteering with local bar associations or in volunteer or pro bono settings, these graduates often end up being in the right place at the right time and securing small firm jobs that might have otherwise gone to other junior lawyers in the job market who were not necessarily recent law school graduates.
However, the number of jobs taken at the largest firms—those with more than 500 lawyers—increased modestly once again to push their share of law firm jobs up by more than two percentage points, from 23.3 percent of law firm jobs in 2015 to 25.5 percent in 2016. This compares with only 16.2 percent in 2011 and 19.1 percent in 2012. Despite the small increase in jobs at the largest firms, the number of law firm jobs overall was down by about 560 from 2015, and the number of jobs taken in the largest firms is at about 82 percent of the levels reached in 2008 and 2009.
At the other end of the spectrum, jobs in the smallest firms of 1–10 lawyers (which includes graduates working for a solo practitioner) accounted for 37.7 percent of law firm jobs, down from 39.5 percent in 2015, and declined in raw numbers from about 6,800 to less than 6,300. Though the number of jobs in the smallest firms is at its lowest level since 2004, the share of jobs in those smallest firms remains higher, and the number still exceeds the number of jobs in the largest firms by close to 50 percent compared with 25–30 percent in 2008 and 2009.
Jobs in the largest law firms have certainly rebounded since collapsing during the recession. For instance, NALP data show that the largest law firms hired about 5,200 entry-level associates in 2008. That number fell all the way to 2,850 by 2011. By 2016 that number had rebounded to about 4,200 but was still shy of the pre-recession figure by about 1,000 jobs. Jobs in the largest law firms have certainly rebounded since collapsing during the recession. For instance, NALP data show that the largest law firms hired about 5,200 entry-level associates in 2008. That number fell all the way to 2,850 by 2011. By 2016 that number had rebounded to about 4,200 but was still shy of the pre-recession figure by about 1,000 jobs. (Industry analysts have estimated that almost 9 percent of all U.S. associates lost their jobs in 2009. In addition, NALP research documented that many law firms canceled or dramatically shrank their summer programs during and immediately after the recession. We also know that according to figures from the U.S. Bureau of Labor Statistics, 60,000 legal employment sector jobs were lost during the recession, only 10,000 of which have come back to date—the legal sector as defined by the Bureau of Labor Statistics is broader than just attorney jobs but is a good indicator of expansion and contraction within the field.)
The wide (and growing) range of jobs in business includes many jobs long considered “nontraditional” jobs—for instance, jobs as tax associates with accounting firms, or consulting jobs with management consulting firms. Some of these jobs, however, are truly new. We’ve come to call them emerging job opportunities for new law school graduates. They include a growing number of jobs in compliance, jobs in health care, jobs with technology companies (both legal and nonlegal), and jobs with legal process outsourcing operations and e-discovery shops. They also include a small number of jobs for entry-level in-house lawyers (entry-level jobs with corporate legal departments accounted for 2 percent of all jobs for graduates of the class of 2016).
Other Markers of an Improving Job Market
The post-recession job market for new law school graduates was not only marked by much lower overall employment rates but by widespread underemployment. That is, in the years that followed the recession many more graduates took jobs that were part-time, or short-term, or both, and the number of graduates employed in long-term, full-time, bar-passage-required work fell from 68 percent for the class of 2008 to just 57 percent for the class of 2011. That number, among others, has risen steadily since then, and for the class of 2016 was measured at 65 percent. The percentage of jobs reported as part-time declined again for the fifth year in a row.
Another marker of the quality of the job market is the portion of graduates who are employed but who are still actively seeking another job, suggesting that the job they have is a stopgap measure or at least that it is not a first-choice job. Of employed graduates from the class of 2016, not quite 17 percent were seeking a different job, a figure that has fallen each year from the record high of 24.6 percent for the class of 2011. The extent to which employed graduates are seeking a different job varies by the kind of job held. For example, about 40 percent of graduates with a job for which a J.D. was an advantage were seeking a different job, compared to 9 percent of those with a job requiring bar passage.
Additionally, the number of graduates setting up their own solo law practice after law school declined again, accounting for 2.8 percent of law firm jobs and 1.5 percent of all jobs, compared with 3.4 percent and 1.7 percent, respectively, for the class of 2015. In fact, the number of graduates setting up a solo practice is as low as it has been in 15 years, and as a percentage of jobs, solo practice levels now match their level of 2007, at 2.8 percent of law firm jobs in both years.
What Can Be Said About the Market for the Next Several Classes?
What is to be made of all this, and what does it portend for the future? The overall employment rate has improved mostly because of two factors. First, and most importantly, the smaller graduating class has meant that there is less competition for the jobs that exist. Second, large law firm hiring has increased fairly steadily since 2011, adding nearly 1,400 jobs in five years. The damper on overall employment growth is that the number of jobs secured in every other sector has fallen steadily over the last three years.
We also know that the run-up in large law firm hiring has likely plateaued. NALP recruiting data from the fall of 2016 show that 50 percent of large law firms reported that they had made fewer offers for summer associate spots for members of the class of 2018 than they had for the class of 2017. We would expect large law firm hiring for the class of 2017 to show additional gains, and we will likely then see a leveling off in that sector for the class of 2018. It is unlikely that large law firm hiring will ever match the highs reached for the classes of 2007 and 2008 when more than 5,000 jobs at the largest law firms were reported for two years in a row.
In the law firm environment, we also know that demand for legal services has been fairly flat and that expenses are once again growing at a faster rate, driven largely by lawyer head count and higher associate salaries, and by the growing costs of technology and cybersecurity measures. And for law firms of every size, growing efficiencies created by technology and business systems, and increased competition from nontraditional legal services providers, will both likely continue to put downward pressure on overall law firm lawyer head count in the coming years and even decades.
Jobs in government and jobs as judicial clerks are likely to be relatively steady, as they have been for many years, despite economic booms and busts. Jobs in business are likely to continue to be important employment opportunities for new graduates, and we would expect to see continued growth in the J.D.-advantage job sector as private practice opportunities continue to diminish and the businesses that compete with law firms continue to grow in size and importance. Work in the public interest sector is likely to continue to be challenged by the falloff in law-school-funded public interest fellowship programs. It should be noted that any change in the current federal student loan repayment and public interest loan forgiveness programs could dramatically alter the public interest jobs landscape in a very short amount of time, as could any dramatic change in the funding or existence of the Legal Services Corporation. A variety of recent legislative proposals, including budget proposals and House and Senate tax bills, as well as proposed changes in the upcoming reauthorization of the Higher Education Act, suggest that all of these are on the negotiating table.
We know that the class of 2017 is yet again smaller than the class of 2016, but the falloff in size from the previous class is less dramatic than the decreases in class size that we have seen over the last two years. The classes of 2018 and 2019 that follow will then be almost exactly the same size as the class of 2017, so we should see level class sizes for at least three years following the falloff in law school applications. Finally, we know that many law schools continue to struggle with lower bar passage rates than they had enjoyed prior to the recession.
All this suggests a continued tight job market for law school graduates at the 10-month mark, or at least tighter than the prerecession market. There is some hope that we might be approaching stability with supply and demand; that is, with law school enrollment “rightsizing” itself, we might be entering a period of time when the number of law school graduates more closely matches the number of jobs available. But we also know that most jobs are not in fact earmarked for new law school graduates, and in many instances, other than certain clerkship opportunities and many large law firm opportunities, graduates will continue to compete with other junior lawyers for most jobs. It is still a scrappy and entrepreneurial job market, where graduates often create their own job opportunities rather than being hired for positions that are vacant. While the percentage of law school graduates who are unemployed and still seeking work 10 months after graduation has come down by 2.5 percentage points to 8.7 percent over the last three years, it continues to be more than twice as high as the unemployment rate measured nine months after graduation in the period prior to the recession. This, more than anything, remains an important marker of the current job market for new law school graduates.
Data analyzed in this article appear in the NALP publication Jobs & JDs: Employment and Salaries of New Law Graduates, Class of 2016, available at www.nalp.org/bookstore.

James G. Leipold is the Executive Director of the National Association for Law Placement (NALP).

Judith N. Collins is the Director of Research for the National Association for Law Placement (NALP).
Contact us to request a pdf file of the original article as it appeared in the print edition.