This article originally appeared in The Bar Examiner print edition, Summer 2018 (Vol. 87, No. 2), pp 27–32.
By Mark A. Albanese, Ph.D.

In February 2018, the mean score on the Multistate Bar Examination (MBE) was 132.8, a 1.3-point decline from the mean score in February 2017. The performance decrease on test questions that had been repeated from previous February exams was consistent with the decrease found for the mean scaled score, indicating that the February 2018 examinees performed less well than previous February examinees. The reliability of the February 2018 MBE (a measure of the extent to which a group of examinees would be rank-ordered the same way over multiple testing sessions) was 0.92 with rounding; when taken to the third decimal point, the value was slightly higher than that in February 2017 and a new high for a February administration. Thus, the low mean score occurred at a point where the precision of the MBE for a February administration was at an all-time high.
The February 2018 mean score was not just lower than the mean from February 2017, it was the lowest MBE mean score on record. The mean score of 134.1 in February 2017 was the previous lowest mean score on record. In fact, the mean MBE score in February has been declining every year since 2013. Thirty-two of 49 jurisdictions (testing 10 or more examinees) had lower MBE scores in February 2018 than a year earlier. Based upon MBE scores alone (jurisdictions include scaled written scores in determining their final pass rates), NCBE estimated that pass rates would have risen from February 2017 in just 19 of the 49 jurisdictions.
Three years ago, this column addressed the sharp 2.8-point drop in the mean score on the July 2014 MBE—the largest year-to-year drop in the past 34 years at that time—and speculated whether that decline was a rogue wave or the leading edge of a storm surge to be repeated as the decline in the number of applicants to law school and the LSAT scores of those admitted continued.1 As can be seen in Figure 1, the mean 25th percentile LSAT score for ABA-accredited law schools for entering classes in 2012 declined 1.24 points to 153.17 from 154.41 in 2011, declining a further 0.40 points to 152.77 in 2013, and a further 0.29 points to 152.48 in 2014. Thus, over this period, as the number of applicants to law school declined, the LSAT scores of admitted students at the 25th percentile, those likely to be at risk of bar examination failure, declined as well.
Figure 1: Law School Matriculants and Mean LSAT Scores at the 25th Percentile, 2011–2017

Note: The mean LSAT scores at the 25th percentile in this graph are based upon all examinees. Some previous data published in the Bar Examiner has presented the mean based upon the average of the means obtained from the jurisdictions. The latter calculation weights small jurisdictions the same as large jurisdictions. Since the large jurisdictions are seeing a greater rebound in LSAT scores than are the small jurisdictions, the latter calculation shows continuing slight declines in mean LSAT scores in 2016 and 2017. The means reported in this article are based upon the total number of examinees and are likely to better represent what will be happening to the national MBE results.
The Matriculants category is used in calculations for years 2011 through 2016. This category is no long reported for year 2017; hence, the First Year Class category is used in calculations for year 2017. As indicated on the ABA website, “The 2017 First Year Class category should nevertheless compare very closely with the Matriculants category in prior years” (https://www.americanbar.org/content/dam/aba/administrative/legal_education_and_admissions_to_the_bar/statistics/2017_509_enrollment_summary_report.authcheckdam.pdf).
Source: ABA Section of Legal Education and Admissions to the Bar, ABA Required Disclosures, http://www.abarequireddisclosures.org/Disclosure509.aspx (last visited June 20, 2018).
While the storm surge clearly continues, it’s noteworthy that the situation is not quite as bleak as it appears. The July MBE mean scores have been rising for the last two administrations, and the March 2018 mean score for the Multistate Professional Responsibility Examination (MPRE) of 94.7 was the highest it has been in March since 2012. So, why is the storm still surging in February MBE scores while receding in July?
Data Sources Available to Shed Light on MBE Scores
To help us understand what is happening with bar exam performance, we need to look at examinee data to understand who sat for the February 2018 bar exam. NCBE does not have a comprehensive database of everyone who sits for the bar examination, so we have some challenges in gathering data about examinees. Examinees register for the bar exam via the jurisdiction in which they seek admission rather than through NCBE. Our researchers are able to use information from examinees’ MBE answer sheets along with their NCBE Numbers and the ethnicity and gender information they provide upon obtaining those numbers. There are some limitations, though; only about 75% of those who obtain an NCBE Number provide ethnicity and gender information. Further, because not all (although most) jurisdictions require examinees to use their NCBE Numbers on the MBE answer sheets, we find that only about 60% of MBE score records have matching ethnicity and gender data. So the information we have on examinee ethnicity and gender is incomplete.
We also have limited information on whether a given examinee is retaking the MBE. The NCBE Number has only been in existence since 2011, so if an examinee took the MBE before 2011 and is repeating, we would have no way of knowing that and would incorrectly classify him or her as a first-time taker. Likewise, if an examinee is taking or previously took the MBE in a jurisdiction that does not require the NCBE Number, we cannot classify that examinee accurately as a first-time taker or a repeater.
Complicating the interpretation of repeater performance is that the repeater composition is changing as the number of jurisdictions adopting the Uniform Bar Examination (UBE) expands. (The recent adoption of the UBE by Tennessee, Rhode Island, and Illinois brings the total to 33 jurisdictions.) Examinees taking the bar examination in a UBE jurisdiction receive a score that is portable to other UBE jurisdictions, meaning that they no longer need to retake the bar examination in the additional jurisdiction to which they seek admission if that jurisdiction is also a UBE jurisdiction. A repeater examinee who is retaking the bar examination in order to seek admission in an additional jurisdiction and has already passed the exam in the initial jurisdiction will be likely to perform well when taking the exam in the other jurisdiction, whereas those retaking the bar examination because they failed the first time are likely to not do as well. As the UBE expands, the percentage of retakers who passed and seek admission to another jurisdiction will decline, while the percentage of retakers who failed will increase. The result is likely to be an increasing failure rate for those who retake the bar examination as the number of jurisdictions adopting the UBE expands.
We also have no information on the law schools that examinees have graduated from, nor when they entered law school or when they graduated (or if they have in fact graduated yet, in the case of jurisdictions that allow third-year law students to sit for the bar exam). Jurisdictions have that information, of course, but there is no routine process for them to share it with NCBE. So our best way of linking MBE scores (and MPRE scores) to law school data is by making reference to the typical law school trajectory—a three-year education. For example, examinees taking the bar examination for the first time in any given July are likely to have entered law school three years previously. So, examinees taking the bar examination for the first time in July 2017 were likely to have entered law school in the fall of 2014.
Finally, contrary to what many may believe, we do not have examinees’ final bar examination scores or passing determinations for non-UBE examinees. These are computed by jurisdictions, most of which report the scores back to us only in aggregate numbers for our annual compilation of bar exam statistics. For UBE jurisdictions, we have examinees’ final UBE scores, but the determination of admission may include additional factors, including character and fitness assessments. (And in the case of suspected cheating, investigations of cheating incidents may lead to changes in passing status.) So, for all these reasons, we qualify our designation to any group as being “likely” (e.g., likely first-time takers), since we do not have—in one place—the definitive data to make such designations.
What we do have is the information provided by the NCBE Number and examinees’ MBE and MPRE scores. We combine our data with aggregate data from other sources, such as the Law School Admission Council, which provides general data on its website regarding the Law School Admission Test (LSAT) for such things as volume of test takers and admitted applicant breakdowns by gender and ethnicity; and the ABA Section of Legal Education and Admissions to the Bar, which provides data on its website regarding law school matriculation, LSAT and undergraduate grade-point-average quartiles, and bar passage outcomes, as part of the required disclosures.
Who Typically Are the February Examinees?
Let’s start by learning more about who takes the bar examination in February to find out what might set them apart from those who do so in July. The most obvious reason for an examinee to take the February bar examination is that he or she failed the bar examination in July. The following February would be the earliest opportunity to retake the exam. In fact, 67% of the February 2018 MBE takers were likely repeaters (NCBE defines a repeater as an examinee who has taken the MBE in any jurisdiction at least once prior to that administration).2 This compares to only about 26% in July 2017. The percentage of likely repeaters in February has increased by about 5% over the last five years (from 62% in 2013). (The percentage of likely repeaters for July administrations has also been increasing steadily since 2013 when the percentage was about 19%.) But what about the 23% or so (10% were untrackable) who were taking the bar examination for the first time in February 2018?
Students completing law school usually do so in May, and the July administration would be the most likely bar examination to take if they are on a typical law school study schedule. Since one generally can’t practice law without passing the bar examination, graduates do not usually delay taking it beyond July without a good reason. We really do not know why examinees would be taking the bar examination for the first time in February. They may be taking it while still in law school, as third-year law students in good standing are allowed to do in Arizona, or they may delay taking it until February because of an extended or part-time law school study schedule, or a desire for additional bar preparation study. What we do know is that first-time takers in February perform less proficiently than first-time takers in July. The mean for likely first-time takers in July 2017 was 144.9, compared to 135.0 in February 2018. This 9.9-point difference is the largest February–July first-time taker differential since at least 2012, but the difference between February and July first-time taker performance has generally been about 7 points. So, February examinees whom we classify as likely first-time takers do not do as well as those in July.
While there are exceptions to the rule, it is generally true that those who repeat the bar examination because they failed on their first attempt consistently perform less well than those who are taking the bar examination for the first time. The February 2018 results for repeaters followed that pattern. Likely repeaters had a mean score of 132.0, the lowest value in the five years since 2013. It is also 1.7 points lower than the February likely-repeater mean score in 2017, which is the largest year-to-year drop for February likely repeaters since at least 2013. Even more telling, when we focus on the subset of these repeaters who are most likely to have failed previously—that is, when we remove the likely repeaters who had an MBE score that was five or more points above the stated passing standard in their previous testing jurisdiction—the decline in performance from 2017 was about two points, from 131.6 in 2017 to 129.5 in 2018. This group of likely failure repeaters constituted roughly 60% of the examinees in February 2017 and February 2018, thus making their impact significant on the overall MBE mean. The poor performance of a high number of likely repeaters taking the February 2018 bar examination clearly contributed to the continuing surge of low MBE scores.
Why Does the Surge Continue for February MBE Scores but Not for July?
July MBE performance has been up, slightly, for the past two administrations (July 2016 and July 2017). Given this, why does the surge of low MBE scores persist in February? To gain a better idea of what may be affecting the surge, it might be helpful to see if there is anything about the academic performance of examinees who sat for the February 2018 bar exam that provides a clue. From the sources of data available, the single best indicator of the academic performance of February examinees may be LSAT scores. The fact that LSAT scores are standardized and equated makes them comparable across time and with different cohorts of students. (Other indicators such as law school grades lack standardization and consistent meaning across time.) If we track back to when the February 2018 bar examinees likely would have entered law school, we can identify them as 2014 entrants who would have been on track to graduate in May 2017 and take the July 2017 bar examination. Those who failed in July would be likely to try again on the February 2018 bar examination. So, data from the 2014 entrants to law school will be the most likely indicator of the source of the continuing surge. Of that group, the most likely candidates to be the primary contributors to the continuing surge, based upon available information, are those in the lowest quartile of LSAT scores.
LSAT Indicators
Figure 1 shows first-year law school matriculants and the 25th percentile LSAT scores from 2011 to 2017. The 25th percentile LSAT score is particularly relevant for this discussion because it reflects the group most likely to fail the bar examination, and matriculant numbers reflect the availability of qualified applicants. In 2014, which is when most of the February 2018 examinees would have entered law school, both law school matriculants and the 25th percentile LSAT score were at the lowest they had been since at least 2011. (The same is true for the 50th percentile and 75th percentile LSAT scores.) The examinees who took the February 2018 bar examination, especially those retaking it after failing in July 2017, had the lowest first quartile LSAT scores since at least 2011. The number of people taking the LSAT in 2013–14, shown in Figure 2, was also at its lowest level since 1998–99.[simple_tooltip content=”Law School Admission Council, Data: Total LSATs Administered—Counts & Percent Increases by Admin & Year, https://www.lsac.org/lsacresources/data/lsats-administered (last visited June 20, 2018).” ]3.[/simple_tooltip] (Note that the number of people taking the LSAT declined even further in 2014–15.) The 2013–14 numbers were also 38% off the peak of 171,514 LSATs taken in 2009–10.4
Figure 2: Law School Admission Tests Administered, 2011–2017
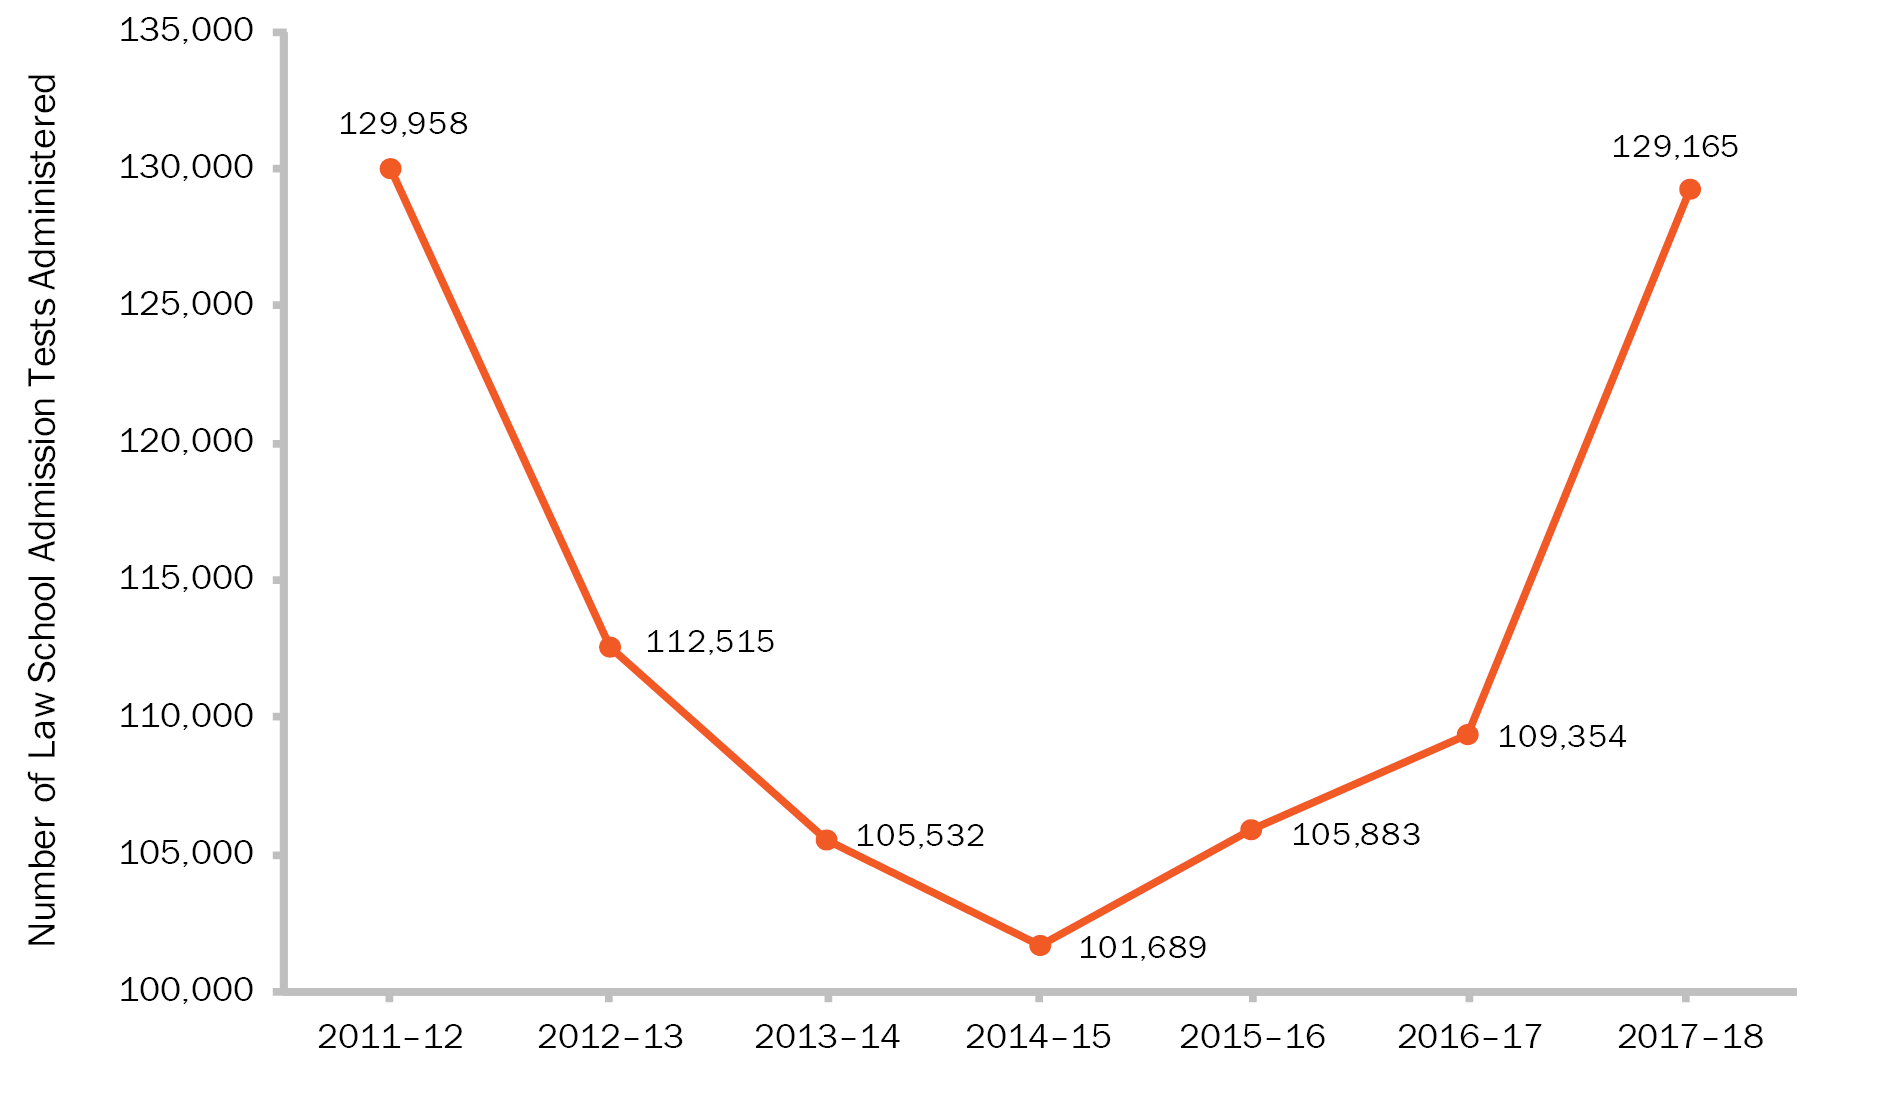
Note: The reporting year runs from June to February, so 2011–12 values represent tests administered between June 2011 and February 2012. Examinees testing during that time period would likely have matriculated in the fall of 2012.
Source: Law School Admission Council, Data: Total LSATs Administered—Counts & Percent Increases by Admin & Year, https://www.lsac.org/lsacresources/data/lsats-administered (last visited June 20, 2018).
July Bar Exam Indicators
On the positive side, the February 2018 mean score for likely first-time takers (135.0) was only about one-third point lower than it was in February 2017 (135.3). Since the decline in mean score for likely first-time takers in February 2017 from February 2016 was about half a point, and the July 2017 MBE first-time taker performance improved, this could portend that MBE scores in July 2018 may stabilize, if not rise, since first-time takers are usually over 60% of the examinees in July. Further, the mean scaled score on the March 2018 MPRE was 94.7, about two points higher than it was in March 2017 and the highest March MPRE score since 2012. From what we can tell, March MPRE examinees are primarily those who are on schedule to graduate in the spring. Therefore, this would lend further support for the potential that July 2018 MBE scores will see another rise.
As shown in Figure 2, the number of LSATs taken continued to decline for 2015 matriculants (that is, those taking the LSAT in 2014–15, who would likely have matriculated in the fall of 2015) but rebounded for 2016 matriculants and continued to rise for 2017 and 2018 matriculants, rising 27% from the low for 2015 matriculants to the 2018 matriculant level. The mean LSAT scores also appear to have bottomed out in 2015 and rose 0.34 points over the following two-year period. Although the mean LSAT scores of those at the 25th percentile have been rising the past two years, as have the number taking the LSAT, the mean LSAT score has yet to reach levels seen for 2011 and prior entry years (154.41 and above), the 2011 matriculants being the ones who experienced the crash in bar passage in 2014. However, the trajectory is such that 2018 may be the year that the academic credentials of those admitted to law school might rise to levels seen before 2014 (for instance, closer to the 152.77 mean score in 2013), which is an encouraging possibility.
February Bar Exam Indicators
The February MBE performance is likely to continue to parallel the 25th percentile LSAT performance of the entering classes as long as the February bar examination continues to be taken predominantly by repeat takers who failed in July and first-time takers who perform less well than those in July. The extent to which repeat takers are composed of those who previously failed is likely to increase as the Uniform Bar Examination (UBE) expands to more jurisdictions. In 2017 alone, approximately 3,700 individuals transferred their UBE scores to another UBE jurisdiction—individuals who might otherwise have retaken the MBE. With the number of UBE score transfers likely to increase, those retaking the MBE will increasingly be those who failed previously. If that is the case, the 25th percentile LSAT data shown in Figure 1 would predict that the February MBE mean scores may continue to decline for the next year or two, even as the July MBE mean scores stabilize or continue to make slight gains.
Conclusion
Failing the bar examination is nothing that anyone likes to see. It can be devastating for the examinee, and it reduces the number of lawyers available to provide service to society. However, having professional standards is essential to ensure that the public is protected from individuals who would practice as professionals without having the necessary knowledge, skills, and abilities. The bar examination continues to serve that critical role. The bar examiners are the unsung heroes who maintain the standards of the profession in this difficult period. We applaud them for their efforts and hope that the performance on the February 2018 MBE is the waning undertow from a storm surge that will soon dissipate.
Notes
- Mark A. Albanese, Ph.D., “The Testing Column: The July 2014 MBE: Rogue Wave or Storm Surge?” 84(2) The Bar Examiner (June 2015) 35–48. (Go back)
- The repeater data presented in this article are based on an examinee having previously taken the MBE in any jurisdiction. This differs from the repeater data presented in the annual statistics published in the Bar Examiner, which is obtained from the jurisdictions and is based on an examinee having previously taken the bar examination in the reporting jurisdiction only. The MBE repeater data are available to NCBE through the NCBE Number that is required for MPRE registration, which NCBE is able to match to the NCBE Numbers reported on MBE answer sheets for jurisdictions that use the NCBE Number as a unique identifier (currently 49 of the 54 jurisdictions that administer the MBE, reflecting over 90% of MBE examinees). (Go back)
- Law School Admission Council, Data: Total LSATs Administered—Counts & Percent Increases by Admin & Year, https://www.lsac.org/lsacresources/data/lsats-administered (last visited June 20, 2018). (Go back)
- Id. (Go back)

Contact us to request a pdf file of the original article as it appeared in the print edition.