33 UBE* Jurisdictions

Map of the United States showing 27 orange jurisdictions that currently administer the UBE and 6 blue jurisdictions that have adopted the UBE but not yet administered it. For an up-to-date list of UBE jurisdictions go online to http://www.ncbex.org/exams/ube/

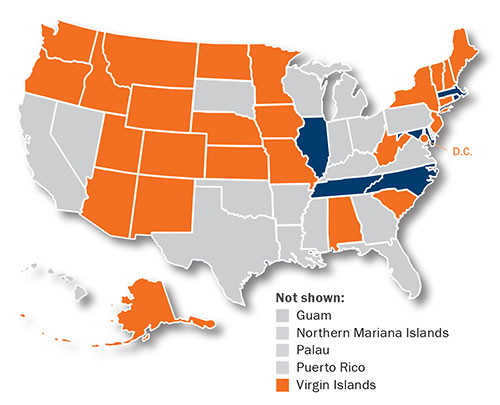
27 jurisdictions currently administer the UBE. 6 jurisdictions will begin administering the UBE at a future administration (Massachusetts, July 2018; North Carolina, Rhode Island, and Tennessee, February 2019; Illinois, July 2019; and Maryland, to be determined).

*The Uniform Bar Examination results in a portable score that can be used to apply for admission in other UBE jurisdictions. For the most current list of UBE jurisdictions, visit: http://www.ncbex.org/exams/ube/

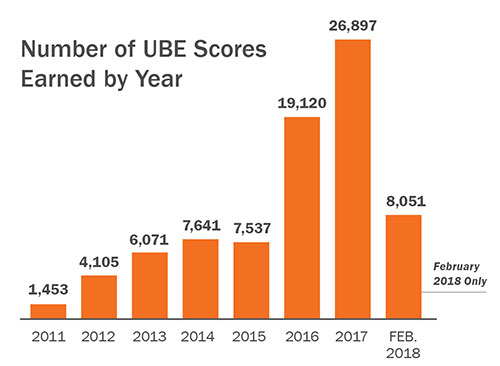
Number of UBE Scores Earned by Year

Graph showing number of UBE scores earned per year. 2011: 1,453; 2012: 4,105; 2013: 6,071; 2014: 7,641; 2015: 7,537; 2016: 19,120; 2017: 26,897; February 2018: 8,051

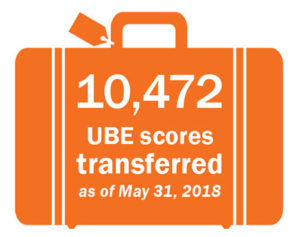
Number of UBE Scores Earned and Transferred

80,875 UBE scores earned 2011-Feb. 201810,472 UBE scores transferred as of May 31, 2018


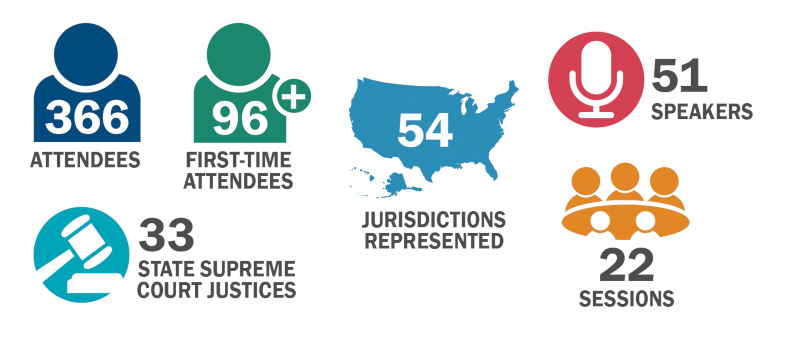
2018 Annual Bar Admissions Conference

April 19–22, 2018, Philadelphia, Pennsylvania

The 2018 NCBE Annual Bar Admissions Conference drew 366 attendees representing 54 jurisdictions, including 33 state Supreme Court justices and 96 first-time conference attendees. Among the attendees were 51 speakers who presented at 22 sessions over the course of the conference.
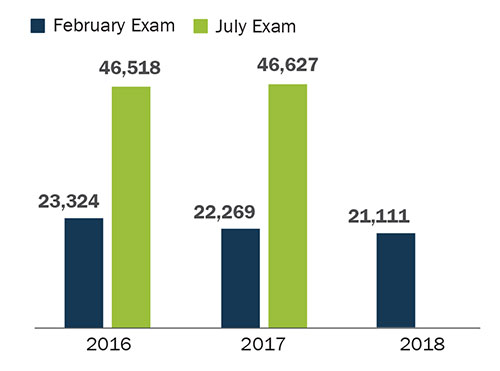
366 attendees, 96 first-time attendees, 33 state supreme court justices, 54 jurisdictions, 51 speakers, 22 sessions


February 2018 MBE

21,111 February 2018 MBE Examinees

Number of MBE Examinees 2016–2018

February 2016: 23,324; July 2016: 46,518 February 2017: 22,269; July 2017: 46,627 February 2018: 21,111

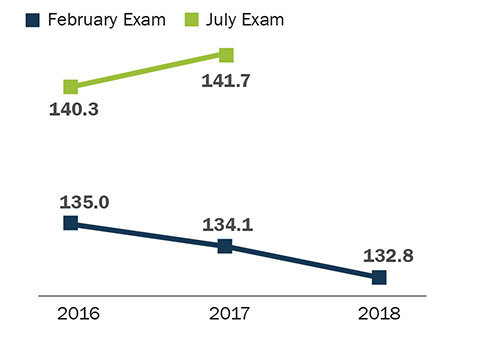
February 2018 MBE Mean Score 132.8

MBE Mean Score 2016–2018

February 2016: 135.0; July 2016: 140.3 February 2017: 134.1; July 2017: 141.7 February 2018: 132.8

Standard Deviations
  February July
2016 15.0 16.7
2017 14.7 16.8
2018 16.0

MBE scores are reported on a scale ranging from 0 to 200. The values reflect valid scores available electronically as of 6/22/18.
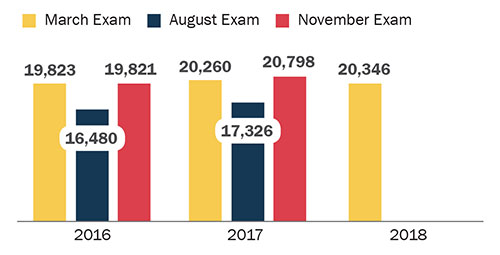

March 2018 MPRE

20,346 March 2018 MPRE Examinees

Number of MPRE Examinees 2016–2018

Number of MPRE examinees March 2016: 19,823; August 2016: 16,480; November 2016: 19,821 March 2017: 20,260; August 2017: 17,326; November 2017: 20,798 March 2018: 20,346

March 2018 MPRE Mean Score 94.7

MPRE Mean Score 2016–2018
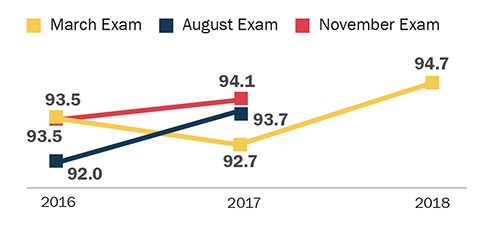
MPRE Mean Scores March 2016: 93.5; August 2016: 92.0; November 2016: 93.5 March 2017: 92.7; August 2017: 93.7; November 2017: 94.1 March 2018: 94.7

Standard Deviations
  March August November
2016 17.6 17.7 17.3
2017 17.1 18.0 17.4
2018 17.9

MPRE scores are reported on a scale ranging from 50 to 150. The values reflect valid scores available electronically as of 6/22/18 on both standard and alternative forms of the MPRE.

  • Bar
    Bar Exam Fundamentals

    Addressing questions from conversations NCBE has had with legal educators about the bar exam.

  • Online
    Online Bar Admission Guide

    Comprehensive information on bar admission requirements in all US jurisdictions.

  • NextGen
    NextGen Bar Exam of the Future

    Visit the NextGen Bar Exam website for the latest news about the bar exam of the future.

  • BarNow
    BarNow Study Aids

    NCBE offers high-quality, affordable study aids in a mobile-friendly eLearning platform.

  • 2023
    2023 Year in Review

    NCBE’s annual publication highlights the work of volunteers and staff in fulfilling its mission.

  • 2023
    2023 Statistics

    Bar examination and admission statistics by jurisdiction, and national data for the MBE and MPRE.