July 2019 MBE

45,334 July 2019 MBE Examinees

Number of July MBE Examinees 2015–2019

Number of July MBE Examinees 2015–2019: This bar graph shows the number of July MBE examinees in the past five years. In July 2015, there were 48,384 examinees; in July 2016, there were 46,518 examinees; in July 2017, there were 46,627 examinees; in July 2018, there were 45,274 examinees; and in July 2019 there were 45,334 examinees.

July 2019 MBE Mean Score 141.1

July MBE Mean Score 2015–2019

July MBE Mean Score 2015–2019: This graph shows the July MBE mean scores for the past five years. The mean score in July 2015 was 139.9; in July 2016 it was 140.3; in July 2017 it was 141.7; in July 2018 it was 139.5; and in July 2019 it was 141.1.

MBE Standard Deviations
July
2015 16.1
2016 16.7
2017 16.8
2018 16.6
2019 16.9

MBE scores are reported on a scale ranging from 0 to 200. The values reflect valid scores available electronically as of 10/23/19.

August 2019 MPRE

17,066 August 2019 MPRE Examinees

More than 4,000 examinees took the August 2019 MPRE at Pearson VUE testing centers across the country for the inaugural computer-based administration of the MPRE. See this issue’s MPRE Inaugural Computer-Based Administration for more information.

Number of MPRE Examinees 2015–2019

Number of MPRE Examinees 2015–2019: This bar graph shows the number of MPRE examinees for the March, August, and November administrations of the exam in the past five years. In 2015, there were 23,160 examinees in March, 16,800 in August, and 19,601 in November; in 2016, there were 19,823 examinees in March, 16,480 in August, and 19,821 in November; in 2017 there were 20,260 examinees in March, 17,326 in August, and 20,798 in November; in 2018 there were 20,346 examinees in March, 16,651 in August, and 20,580 in November; and in 2019 there were 19,138 examinees in March and 17,066 in August. (The November 2019 MPRE has not yet been administered.)

August 2019 MPRE Mean Score 93.4 (score scale 50–150)

MPRE Mean Score 2015–2019

MPRE Mean Score 2015–2019: This graph shows the mean scores on the March, August, and November administrations of the MPRE in the past five years. In 2015, the mean score in March was 94.6, in August was 92.9, and in November was 97.3; in 2016, the mean score in both March and November was 93.5 and in August was 92.0; in 2017, the mean score in March was 92.7, in August was 93.7, and in November was 94.1; in 2018, the mean score in March was 94.7, in August was 93.0, and in November was 95.5; and in 2019, the mean score in March was 93.8 and in August was 93.4. (The November 2019 MPRE has not yet been administered.)

MPRE Standard Deviations
March August November
2015 17.4 16.9 17.5
2016 17.6 17.7 17.3
2017 17.1 18.0 17.4
2018 17.9 17.8 18.2
2019 17.9 17.5

MPRE scores are reported on a scale ranging from 50 to 150. The values reflect valid scores available electronically as of 10/23/19 on both standard and alternative forms of the MPRE.

Uniform Bar Examination

15 of the 36 jurisdictions that have adopted the UBE have decided to require completion of a jurisdiction-specific component prior to admission.

Graph: 42% of UBE jurisdictions require completion of a jurisdiction-specific component prior to admission.
42% of UBE jurisdictions require completion of a jurisdiction-specific component prior to admission.

See this issue’s Testing Knowledge of Local Law: What Are UBE Jurisdictions Doing? for more information.

July 2019 MEE/MPT Grading Workshop

NCBE holds its semiannual MEE/MPT Grading Workshops to support jurisdiction graders in their grading of the Multistate Essay Examination and the Multistate Performance Test.

546 graders from 44 jurisdictions participated in the July Grading Workshop. 56 graders were in person, 167 by conference call, and 323 by on-demand546 graders from 44 jurisdictions participated in NCBE’s MEE/MPT Grading Workshop the weekend after the July 2019 exam.
56 graders participated in person, 167 by conference call, and 323 by registering to view on-demand videos.

2019–2020 NCBE Policy Committee Members’ Home Jurisdictions

81 members representing 46 jurisdictions

2019–2020 NCBE Policy Committee Members’ Home Jurisdictions: This map shows the 46 home jurisdictions of the 81 members of NCBE’s nine policy committees. All jurisdictions are represented on the committees except for Delaware, Maine, Montana, Rhode Island, Wisconsin, Guam, Northern Mariana Islands, Palau, Puerto Rico, and the Virgin Islands.

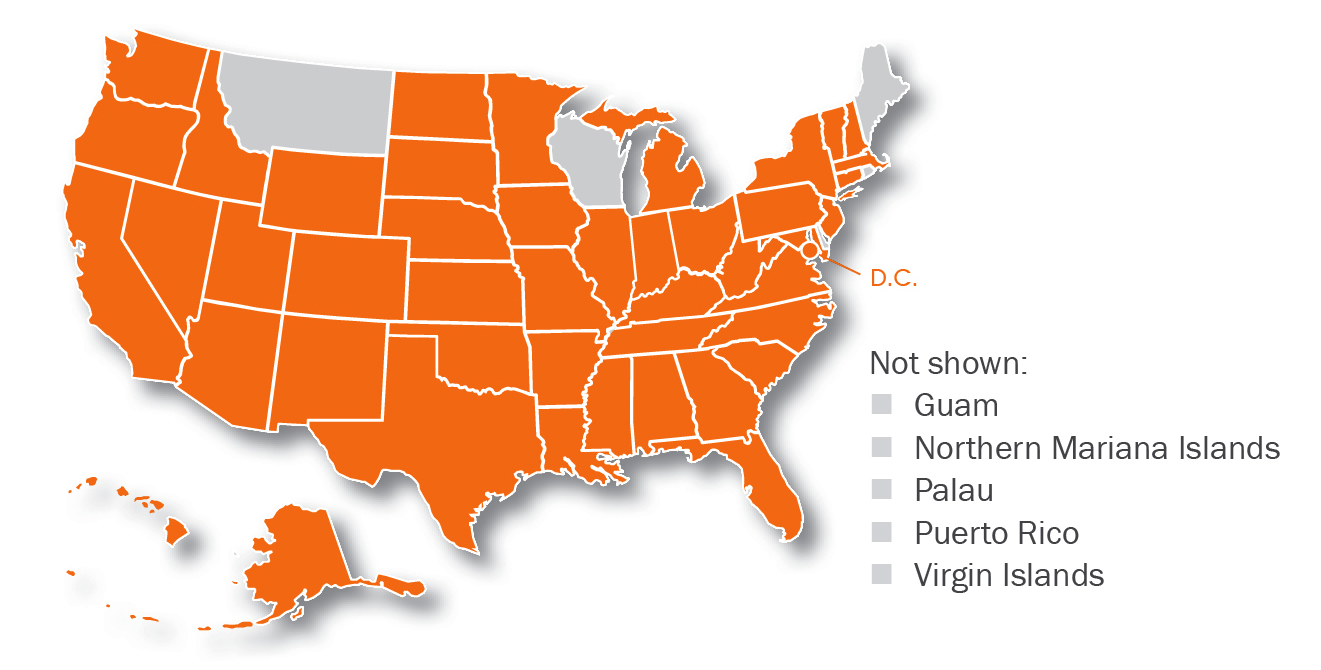
NCBE is advised by the members of its nine policy committees, whose members are appointed each August. The 81 members of NCBE’s 2019–2020 policy committees represent 46 jurisdictions and include current and former bar examiners, bar admission administrators and staff, justices, and judges.


2019–2020 NCBE Exam Drafting Committee Members’ Home Jurisdictions

65 members representing 25 jurisdictions

2019–2020 NCBE Exam Drafting Committee Members’ Home Jurisdictions: This map shows the 25 home jurisdictions of the 65 members of NCBE’s 10 exam drafting committees. Those 25 jurisdictions are Arizona, Arkansas, California, Colorado, the District of Columbia, Florida, Georgia, Iowa, Louisiana, Massachusetts, Michigan, Minnesota, Mississippi, Missouri, New Jersey, New Mexico, New York, North Carolina, Ohio, Oklahoma, Pennsylvania, Tennessee, Texas, Virginia, and Wisconsin.

NCBE exams are written by the members of NCBE’s 10 exam drafting committees. The 65 members of NCBE’s 2019–2020 exam drafting committees represent 25 jurisdictions and include practicing attorneys, judges, and law school faculty members.

[apss_share]
  • Bar
    Bar Exam Fundamentals

    Addressing questions from conversations NCBE has had with legal educators about the bar exam.

  • Online
    Online Bar Admission Guide

    Comprehensive information on bar admission requirements in all US jurisdictions.

  • NextGen
    NextGen Bar Exam of the Future

    Visit the NextGen Bar Exam website for the latest news about the bar exam of the future.

  • BarNow
    BarNow Study Aids

    NCBE offers high-quality, affordable study aids in a mobile-friendly eLearning platform.

  • 2023
    2023 Year in Review

    NCBE’s annual publication highlights the work of volunteers and staff in fulfilling its mission.

  • 2022
    2022 Statistics

    Bar examination and admission statistics by jurisdiction, and national data for the MBE and MPRE.