This article originally appeared in The Bar Examiner print edition, December 2016 (Vol. 85, No. 4), pp 29–35.
By Mark A. Albanese, Ph.D.Grading essays and Multistate Performance Tests (MPTs) is no small challenge. Several articles in this publication have detailed NCBE’s recommendations for how the grading should be done and have offered suggestions for how graders should employ relative grading (the practice of distinguishing between papers and rank-ordering them in accordance with the jurisdiction’s particular score scale).1 One such article points out that “[it] may . . . be helpful for a grader or graders to try to put papers in buckets or piles representing each point on the score scale to ensure that they are, in fact, using the whole score scale . . . .”2 Although the article does not specifically say that there should be targets set for the percentage of papers that should be in each bucket, it does say that each bucket should have something in it. At least one jurisdiction has set out targets that approximate a normal (bell-shaped) curve, where extremely low-scoring and extremely high-scoring buckets are assigned proportionately small numbers as targets, while those in the middle get larger target numbers.
For all UBE jurisdictions and the other jurisdictions that sum the grades across essays and MPTs to arrive at a total written score, the ultimate goal of spreading the grades awarded to individual essays and MPTs is to improve the precision with which the total written score rank-orders examinees. Although theory strongly supports the idea that more spread yields greater precision, what that means from the perspective of a grader trying to assign grades one essay after another can be somewhat indefinite. Generally, the degree of spread in a set of scores is measured by the standard deviation (SD), which can be thought of as the average deviation of scores from the mean. In grading essays and MPTs, there are generally more essays than there are grade points, so many essays will get the same grade.
How the number of essays getting the same grade relates to the item SD can be confusing. The purpose of this article is to show how the grades assigned to a group of 30 essays relate to the spread of grades as represented by the SD and then to show how the SD relates to the essay score’s correlation with the total written score and with the MBE score. The correlation of the essay grade with the total written score can be considered an essay-level internal consistency reliability estimate, a surrogate for the reliability we report for the overall examination. (As a reminder, one way of thinking about reliability is that it is the extent to which a group of examinees would be rank-ordered the same if a second similar test was administered.) The correlation of the written score with the MBE score provides an analogous type of reliability estimate, since the MBE score and the total written score are considered to be measuring common abilities but by different methods.
How Grades Assigned Relate to the Spread of Grades as Represented by the SD
NCBE uses a six-point scale when demonstrating the grading of essays and MPTs. For the purposes of illustrating how spread in grades affects the SD, a six-point scale works fairly well. There are enough different grade points that spread can be easily seen, yet not so many that one gets lost in the details of computation. The first part of this study shows how the SD changes as a group of 30 essays are assigned to the six different grade options and as the number of essays assigned to the highest and lowest categories is systematically varied and the displaced essays are moved to the interior grade categories.
For the study, the assignment began with a uniform distribution, meaning that the 30 essays were distributed uniformly among the six grade categories (i.e., five essays to each category). The assignment to grading categories held the mean grade constant at 3.5, the midpoint between the grades of 1 and 6. This constraint enables the SD to achieve the largest value possible, since scores would have the broadest possible range on both the high and low sides. Keeping the mean constant requires that the change of one value is accompanied by the opposite change of another value such that it keeps the total sum of the scores constant. Thus, moving an essay from a grade of 1 to a grade of 2 increases the total by one point, and to compensate and keep the total the same requires moving another essay down a grade (as from 6 to 5). Besides enabling the SD to be the largest possible, keeping the mean constant at 3.5 avoids having to disentangle how changes in the mean affect the relationship of the SD to the distribution of different numbers of essays to each grade category.
The assignment also considered only distributions that were bell curve–like, meaning that the grade(s) given to the highest number of essays were in the center and the falloff on both sides was symmetric (i.e., mirror images of one another). In the example, if we move an essay from a grade of 1 to a grade of 2, to keep the mean constant and the distribution bell-like, we would have to move an essay from the highest grade category, 6, to a 5. A bell-curve shape is not an arbitrary choice. A bell-curve shape is also referred to as the normal distribution because most measures of humans tend to fall in a bell-shaped curve. Further, we most often observe score distributions on the bar examination to follow a bell-curve shape.
The distributions were considered to have six different forms based upon the number of essays in the extreme grades of 1 and 6. These six different forms are shown in Figure 1. (Numbers on the vertical axis on the left are the essay grade, or bucket; x’s to the right each represent an essay; the number at the end of the string of x’s is the number of essays contained in the grade category [the single- or double-digit number itself standing for one or two x’s]; and the number at the bottom is the SD for the distribution of the essay grades).
Figure 1: Simulated bell-like grade (G) distributions and standard deviations (SD) of 30 essays with a mean of 3.5
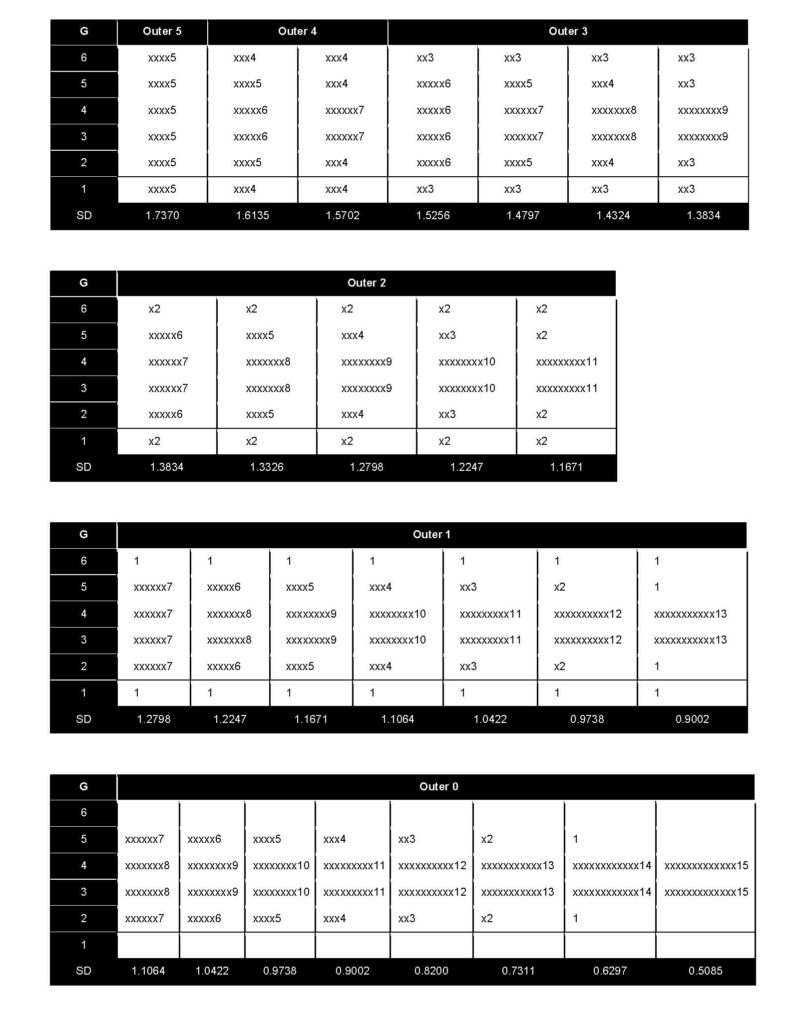
The first form, called outer 5, had five essays in each of the extreme values of 1 and 6. There was only one distribution for outer 5, and it was the uniform distribution noted earlier. Although the uniform distribution is not much like a bell, it has symmetry, and the center is the high point; it is just that all the grade categories are just as high as the center. The uniform distribution provides the largest spread of any symmetrical distribution that has the high point in the center.
The second form, called outer 4, had four essays in each of the extreme values of 1 and 6, which resulted from moving one essay from each of the two extreme values in the outer 5 uniform distribution to the interior grade categories. The first of two outer 4 distributions was created from the outer 5 uniform distribution by moving one essay with a grade of 6 to a grade of 4 and one essay with a grade of 1 to a grade of 3. This resulted in grades of 1 and 6 having four essays (a requirement for being in the outer 4 form), grades of 2 and 5 having five essays, and grades of 3 and 4 having six essays. The second variation for the outer 4 form again had four essays with grades of 1 and 6 but had only four essays with grades of 2 and 5. The grades of 3 and 4, however, had seven essays in each.
This process continued, with each subsequent form producing a higher number of distributions, until reaching form outer 0, where there were zero essays given the grade of either 1 or 6.
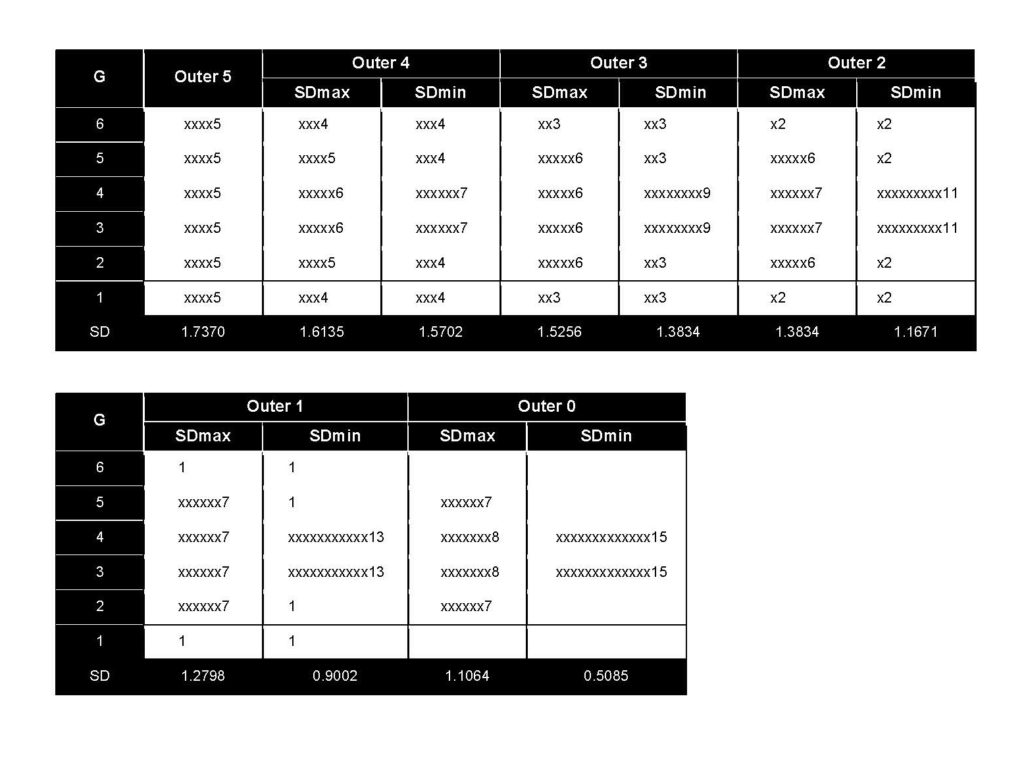
Again, Figure 1 shows the distributions and their SDs derived for all six forms, outer 5 through outer 0. For each distribution form, as you move from left to right, the distribution becomes more peaked in the center, and the SD (shown at the bottom) becomes smaller. Figure 2 makes this more pronounced by showing the distribution with the maximum SD (SDmax) and minimum SD (SDmin) side by side for each of the six forms. As can be seen in Figures 1 and 2, the uniform distribution (outer 5) has the largest SD, and the SDs decrease as the distribution becomes narrower and narrower until only two grade categories are used (the last distribution on the right under outer 0). From a practical standpoint, we want to spread scores out as much as possible, but it is not necessary for the number of essays to be evenly distributed in each grade category; there are a range of distributions that achieve reasonably spread-out grades, but they tend to involve having some percentage of examinees in each grade category and not “bunching up” examinees too much into a small number of grade categories. In other words, uniform and bell-shaped distributions of grades are reasonable ways of “bucketing” examinees to ensure good spread in grades.
Figure 2: Distributions with maximum (SDmax) and minimum (SDmin) SD values for each outer form
The Relationship of the Item’s SD to the Item’s Correlation with the Total Written Score and with the MBE Score
Just having a small SD is of no consequence—unless there are consequences. Important aspects of essay grades are how well they correlate with (a) the total written scores and (b) the MBE scores. As stated earlier, the correlation between an individual essay score and the total written score is an estimate of the essay score’s reliability. The correlation of an essay score with the MBE score is another useful index of reliability because the MBE and the written components are alternative but overlapping measures. To show how essay grade distribution shape related to correlations of the essay grades with the total written scores and the MBE scaled scores, real data from a relatively large jurisdiction using the six-point scale in July 2015 and February 2016 served to generate random samples corresponding to different distributions.
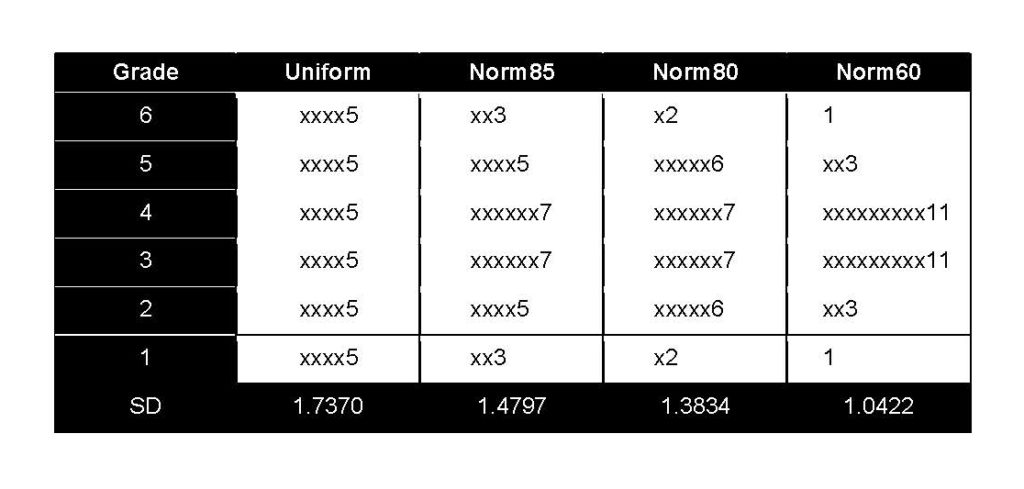
The uniform distribution (outer 5) and distributions that had SDs that were 85%, 80%, and 60% as large as that from the uniform distribution were used to generate 100 samples of 30 essays each. From each random sample of 30, the correlation of the essay grade with the total written score and with the MBE scaled score were computed for one MEE and one MPT. The results of the analyses from these samples are shown in Table 1. The distribution with an SD 85% as large as that of the uniform distribution is labeled norm85. The distributions with SDs 80% and 60% as large are labeled norm80 and norm60, respectively.
Table 1 shows the median and minimum and maximum values for these two types of correlations for the MEE and MPT from July 2015 and February 2016 data. The distributions for the uniform distribution, norm85, norm80, and norm60 are shown at the bottom of the table for reference purposes.
Table 1: Item Reliability as a Function of Grade Distributions at the Uniform Distribution and at 85%, 80%, and 60% of the Uniform Distribution for 100 Randomly Selected Samples
1. Item reliability: MEE/MPT correlations with written total
File "/var/www/vhosts/thebarexaminer.ncbex.org/httpdocs/wp-content/uploads/2016/December/850416_Test-Column-Item-Reliability-1v2.xlsx" does not exist.
2. Item reliability: MEE/MPT correlations with MBE scaled score
File "/var/www/vhosts/thebarexaminer.ncbex.org/httpdocs/wp-content/uploads/850416_Test-Column-Item-Reliability-22.xlsx" does not exist.
3. Distributions for uniform, norm85, norm80, and norm60
As the MEE and MPT SD declined as a fraction of that of the uniform distribution, the median of both the essay–total correlation and the essay–MBE correlation declined (except for norm80 for the essay-MBE correlation, which shows 0.34, a slight increase from norm85 of 0.32). For the most part, the decline in the two correlations was proportionate to the decline in the essay SD.
Summary Remarks
The decline in essay SD did have consequences for the two primary reliability indices we use for the bar examination. The larger the SD, the higher the correlation between the essay score and the total written score as well as between the essay score and the MBE scaled score. There are limits, however. The largest SD that could be achieved would be if half the essays received a grade of 1 and the other half received a grade of 6. The SD would be 2.5427 in that case, compared to 1.7370 for the uniform distribution. The median value of the reliability correlations for this extreme case would also increase by 0.08 to 0.19 over those for the uniform distribution based upon the 100 random sample approach. However, having half the essays deserving a grade of 1 and the other half deserving a grade of 6, and none in between, would be extremely rare in practice. Forcing this type of distribution would be an ill-advised practice because it ignores most of the grading scale and effectively makes a six-point scale into a two-point scale, and certainly in practice graders would find it to be an unnatural and rather repulsive thing to do.
Bell-like distributions of scores were used in this study because that tends to be the way graders assign grades when left to their own devices even if not cajoled into spreading grades out across the score range. The uniform distribution had the largest SD in this context and the highest median correlations with the written total score and the MBE score, but to put equal numbers of essays into each of the six grading categories may not be a particularly natural thing for graders to do.
The analysis above indicates that a uniform distribution and bell-shaped distributions that have some percentages of scores at each grade level are reasonable for ensuring adequate statistical qualities of essay scores, which supports NCBE’s recommendation that graders use the entire score scale and do their best to spread out scores. But it is also important to acknowledge that essays should get different grades only if quality differences merit different grades, not to hit targets for allocations to grading categories. Spread does make a difference in the precision of the grades awarded, but only if it is meaningful and not spread for the sake of spread.
Acknowledgments
The data in this article were provided by NCBE Testing and Research Department staff member Dr. Andrew A. Mroch.
Notes
- Susan M. Case, Ph.D., “The Testing Column: Procedure for Grading Essays and Performance Tests,” 79(4) The Bar Examiner (November 2010) 36–38; Judith A. Gundersen, “The Testing Column: Essay Grading Fundamentals,” 84(1) The Bar Examiner (March 2015) 54–56; Judith A. Gundersen, “It’s All Relative—MEE and MPT Grading, That Is,” 85(2) The Bar Examiner (June 2016) 37–45. (Go back)
- Gundersen (March 2015), supra note 1, at 56. (Go back)
 Mark A. Albanese, Ph.D., is the Director of Testing and Research for the National Conference of Bar Examiners.
Contact us to request a pdf file of the original article as it appeared in the print edition.