This article originally appeared in The Bar Examiner print edition, December 2015 (Vol. 84, No. 4), pp 4–7.
By Erica Moeser Since the release of the July 2014 bar examination results, there has been a lot of ink spilled (not to mention a lot of blog keys struck) commenting on, criticizing, and explaining the reasons for the dip in bar passage rates, which are correctly associated in most jurisdictions with the decline in scaled scores on the Multistate Bar Examination (MBE). The arc of criticism is similar to that of the stages of grief; periods of denial and anger are now being overtaken by a fuller understanding and regretful acceptance.
At first, critics accused the test of being incorrectly scored. We replicated and confirmed the July 2014 MBE scoring both internally and through the use of outside experts, producing consistent and convincing evidence that no error had occurred.
Later, critics seized on the software failure experienced by examinees in many jurisdictions on the day and night preceding the administration of the 2014 MBE when those examinees used software (unrelated to NCBE) to try to upload their responses to the written components of the bar exam for grading by the jurisdictions. Our research into the possible impact of that failure did not establish a connection between locations experiencing the failure and patterns of score decline. (Had the failure been shown to explain the drop, the only viable remedy would have been for jurisdictions to offer an opportunity to retest.)
Moving into 2015, questions arose about whether the addition of Civil Procedure as the seventh MBE content area accounted for poor February performance. Our research is solidly convincing that the addition of Civil Procedure had no impact on the MBE scores earned on the February and July 2015 MBE administrations.
The rhetoric has recently shifted to attacking MBE content. The validity of the MBE has been established by an accumulation of evidence. Most recently and significantly, NCBE conducted an extensive job analysis, which revealed and highlighted what new lawyers do as well as what knowledge and skills they need in order to perform their work. The MBE and our other tests correspond with the results of the job analysis.
The bar exam—that is, the MBE plus the written components that accompany it—does not purport to predict who will become an effective lawyer. It does not attempt to test all the knowledge and skills that a new lawyer must have mastered. (This is not to say that we at NCBE are not constantly exploring what more can be tested efficiently and effectively. That is an ongoing objective.) What the MBE and our written tests do represent is a carefully constructed, thoroughly considered, and consistently administered battery of tests that are appropriate for gauging whether a new lawyer demonstrates readiness for licensure.
It may be helpful to include a word about the ways in which jurisdictions use MBE scores to make determinations about who passes and who fails. While the MBE scaled score is released on a national level (that is, all examinees who take the same test are scored on the same scale), scores as reported to each jurisdiction have added information about the mean and standard deviation of the MBE scores earned in that jurisdiction. The fact that the July 2015 MBE scaled score mean dropped by 1.6 points across jurisdictions does not mean that the drop was the same in all jurisdictions.
Looking at the July 2015 MBE results, of the 49 states (Louisiana is excluded) and the District of Columbia, there were 12 jurisdictions in which the MBE mean score actually rose and 38 in which it declined. When jurisdictions set their written scores on the MBE scale, a best practice that most jurisdictions follow, the written scores are arrayed against the spectrum of MBE scores earned in that jurisdiction. Thus, while the 1.6-scale-point drop reported for the MBE scores nationally is of interest, operationally it is the rise or drop in each jurisdiction that sets its written scores on the MBE scale that causes the percentage of passers and failers to rise or fall.
To further explain the rise or fall of passing rates, some graphs may be useful. It is commonly known that each jurisdiction establishes its own passing score. The pass/fail points selected tend to fall in the mid-130s on the 200-point MBE scale, but there are passing scores that dip into the high 120s and a few that reach the mid-140s. (A list of passing scores appears in the Comprehensive Guide to Bar Admission Requirements published annually and available on the NCBE website.) When the pass/fail line, or cut score, selected by the jurisdiction happens to hit near the peak of the bell curve representing examinees, the impact of a change in examinee performance will have greater effect on the number of people who pass or fail than would be the case if the cut score fell in the tail of the bell curve.
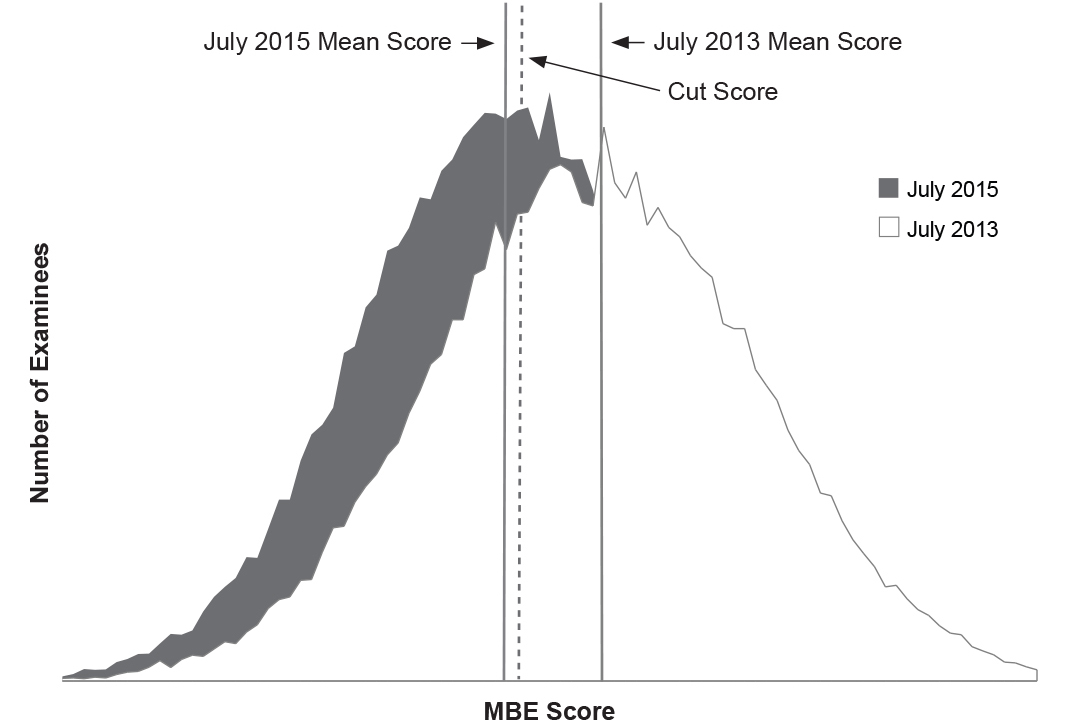
As an example, Figure 1 depicts the MBE performance of examinees in one jurisdiction during the July 2013 and July 2015 test administrations. July 2015 bar examination results appear in dark gray and July 2013 results appear in white. Areas of overlap appear in light gray. Note that the cut score (the dotted line) falls just above (i.e., to the right of) the solid black line marking the average score in July 2015 and significantly below (i.e., to the left of) the solid gray line marking the average score in July 2013. This fact alone makes clear that the pass rate should be higher in the July 2013 administration (where more people did better than required to pass) than in the July 2015 administration (where more people did worse than required to pass), assuming that the written component is scaled to the MBE and assuming a roughly normal distribution. Given that scores are indeed roughly normally distributed, having the cut score close to the July 2015 mean results in a close-to-even bisection of the dark gray bell curve representing the July 2015 examinees: about half would be expected to pass and about half to fail. Contrast that pattern with the one for July 2013: the (same) cut score falls farther from the center of the distribution (i.e., the average score), and so, again, a much higher proportion of July 2013 examinees would be expected to pass (i.e., fall to the right of the cut score) than was true in July 2015.
Figure 1: MBE performance of examinees in one jurisdiction, July 2013 and July 2015, related to cut score
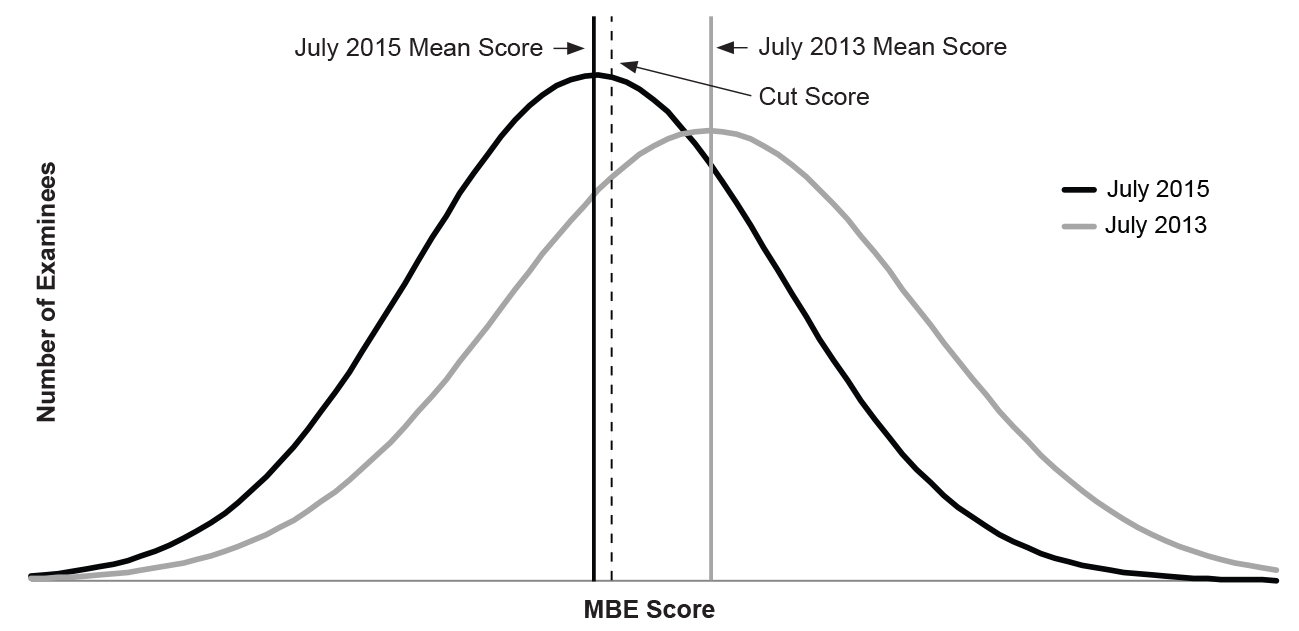
An abstracted expression of the same information is shown in Figure 2, assuming normal curves. July 2015 bar examination results appear in black and July 2013 results appear in gray. It should be intuitive that a lower MBE average score would typically be associated with a lower passing rate, though if the cut score were way out in the left tail of the distribution, the difference in pass rates between July 2013 and July 2015 would be small. However, the cut score is not in the tail of the distribution: it is close to the center of the distribution, where the largest numbers of examinees are represented, particularly for July 2015. This means that small shifts in the mean score would be associated with relatively big changes in the passing rate.
Figure 2: MBE performance of examinees in one jurisdiction, July 2013 to July 2015, related to cut score (abstracted expression)
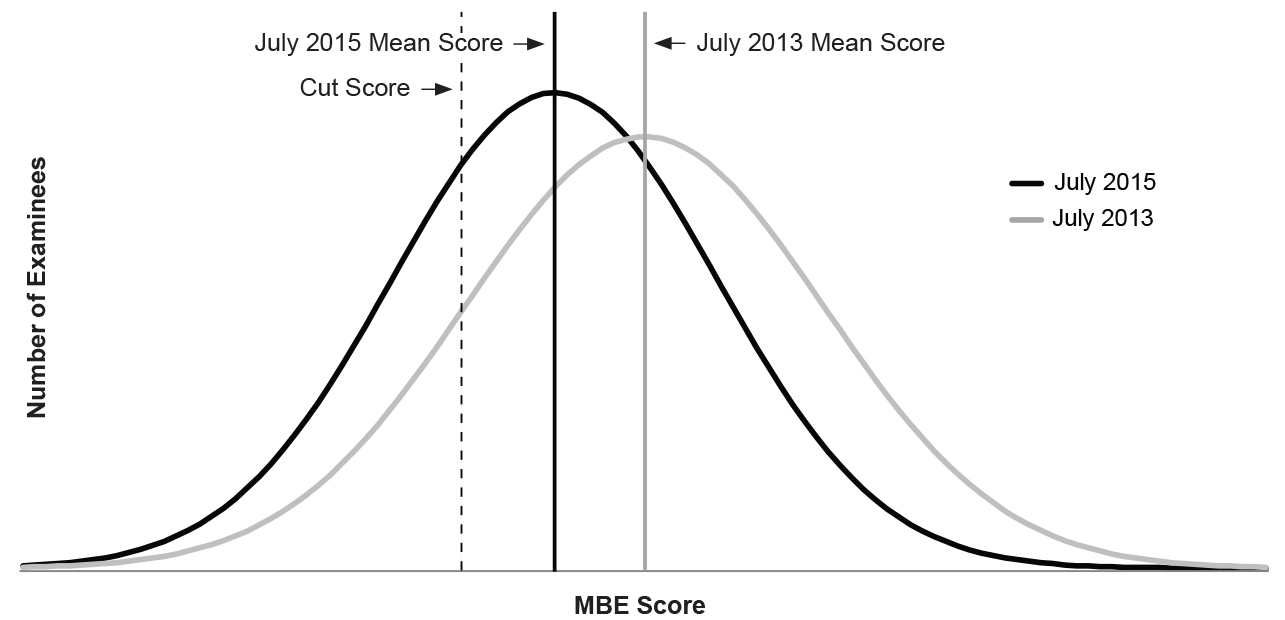
As an example of a situation in which a dramatic drop would not occur, Figure 3 depicts a jurisdiction where the averages from both the July 2013 and July 2015 bar examinations were well to the right of the dotted line depicting the cut score. While the percentage of examinees failing increased in this jurisdiction in July 2015 relative to July 2013 because the distribution “shifted left” in July 2015, the decline was not as dramatic as the one depicted in the previous example.
Figure 3: MBE performance of examinees in a second jurisdiction, July 2013 to July 2015, related to cut score
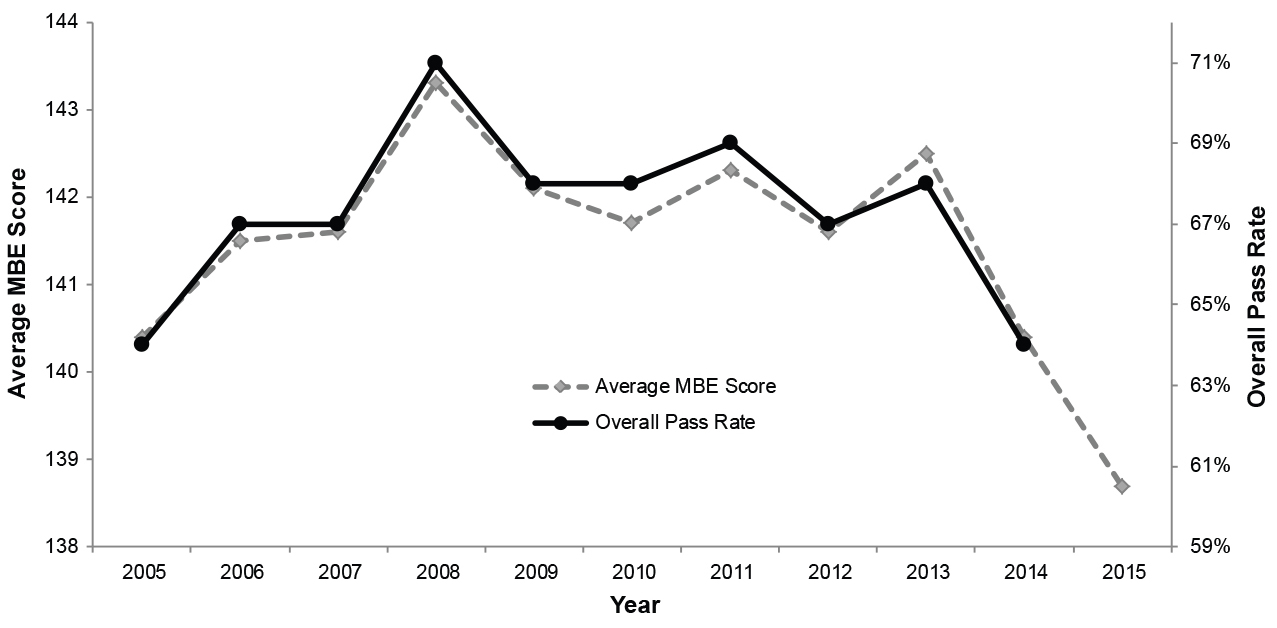
There are, of course, other variables, including whether—and the extent to which—a jurisdiction performs some sort of regrading process following the combination of written and MBE scores that can impact pass rates and change the relationship between MBE score and pass rate. We know from experience that there are many permutations of weighting and regrading in practice that resist generalization. However, as illustrated in Figure 4, historically the average MBE score and the pass rate have tracked fairly closely across jurisdictions (though not necessarily within each jurisdiction).
Perhaps the most sobering graph in 2015 is the one with which I close this column, shown in Figure 4. While we will not know the exact placement of the point that expresses the overall pass rate for 2015 until all jurisdictions have reported final results later this year, we can forecast that the line will join the MBE line in descent. And there is no reason to believe that the line will flatten out or ascend in 2016 and 2017 barring a very strong educational initiative on the part of many law schools.
Figure 4: Average MBE score and overall pass rates by year
As another year ends, it is especially satisfying to look at the progress that has been made to make the Uniform Bar Examination a reality across the states. The recent addition of New Mexico brings the number to 19. In 2015 we added Iowa, Kansas, New Mexico, New York, and Vermont. All of these jurisdictions moved quickly to implement the UBE: Iowa, Kansas, and New Mexico are launching in February 2016, and New York, and likely Vermont, will follow in July. In addition, committees charged with studying the UBE for possible adoption are at work in several jurisdictions. The UBE has turned an important corner. Welcome, New Mexico!
Contact us to request a pdf file of the original article as it appeared in the print edition.