The Uniform Bar Examination (UBE)
The Uniform Bar Examination (UBE), coordinated by the National Conference of Bar Examiners, is composed of the MEE, two MPT tasks, and the MBE. Its first administration was in February 2011. It is uniformly administered, graded, and scored and results in a portable score that can be used to apply for admission in other UBE jurisdictions.
The UBE is designed to test knowledge and skills that every lawyer should be able to demonstrate prior to becoming licensed to practice law.
NCBE scores the MBE component of the UBE. Jurisdictions grade the MEE and MPT components. The MEE and MPT scores are scaled to the MBE, and UBE total scores are calculated by NCBE. The MBE is weighted 50%, the MEE 30%, and the MPT 20%. UBE total scores are reported on a 400-point scale.
UBE jurisdictions agree to certain administrative policies in order to generate scores that qualify to be certified by NCBE as UBE scores. UBE jurisdictions independently set other policies, such as establishing their own passing scores, determining how long incoming UBE scores will be accepted, and whether or not to require applicants to complete a jurisdiction-specific component, such as a course or test on jurisdiction-specific law, either pre- or post-admission.
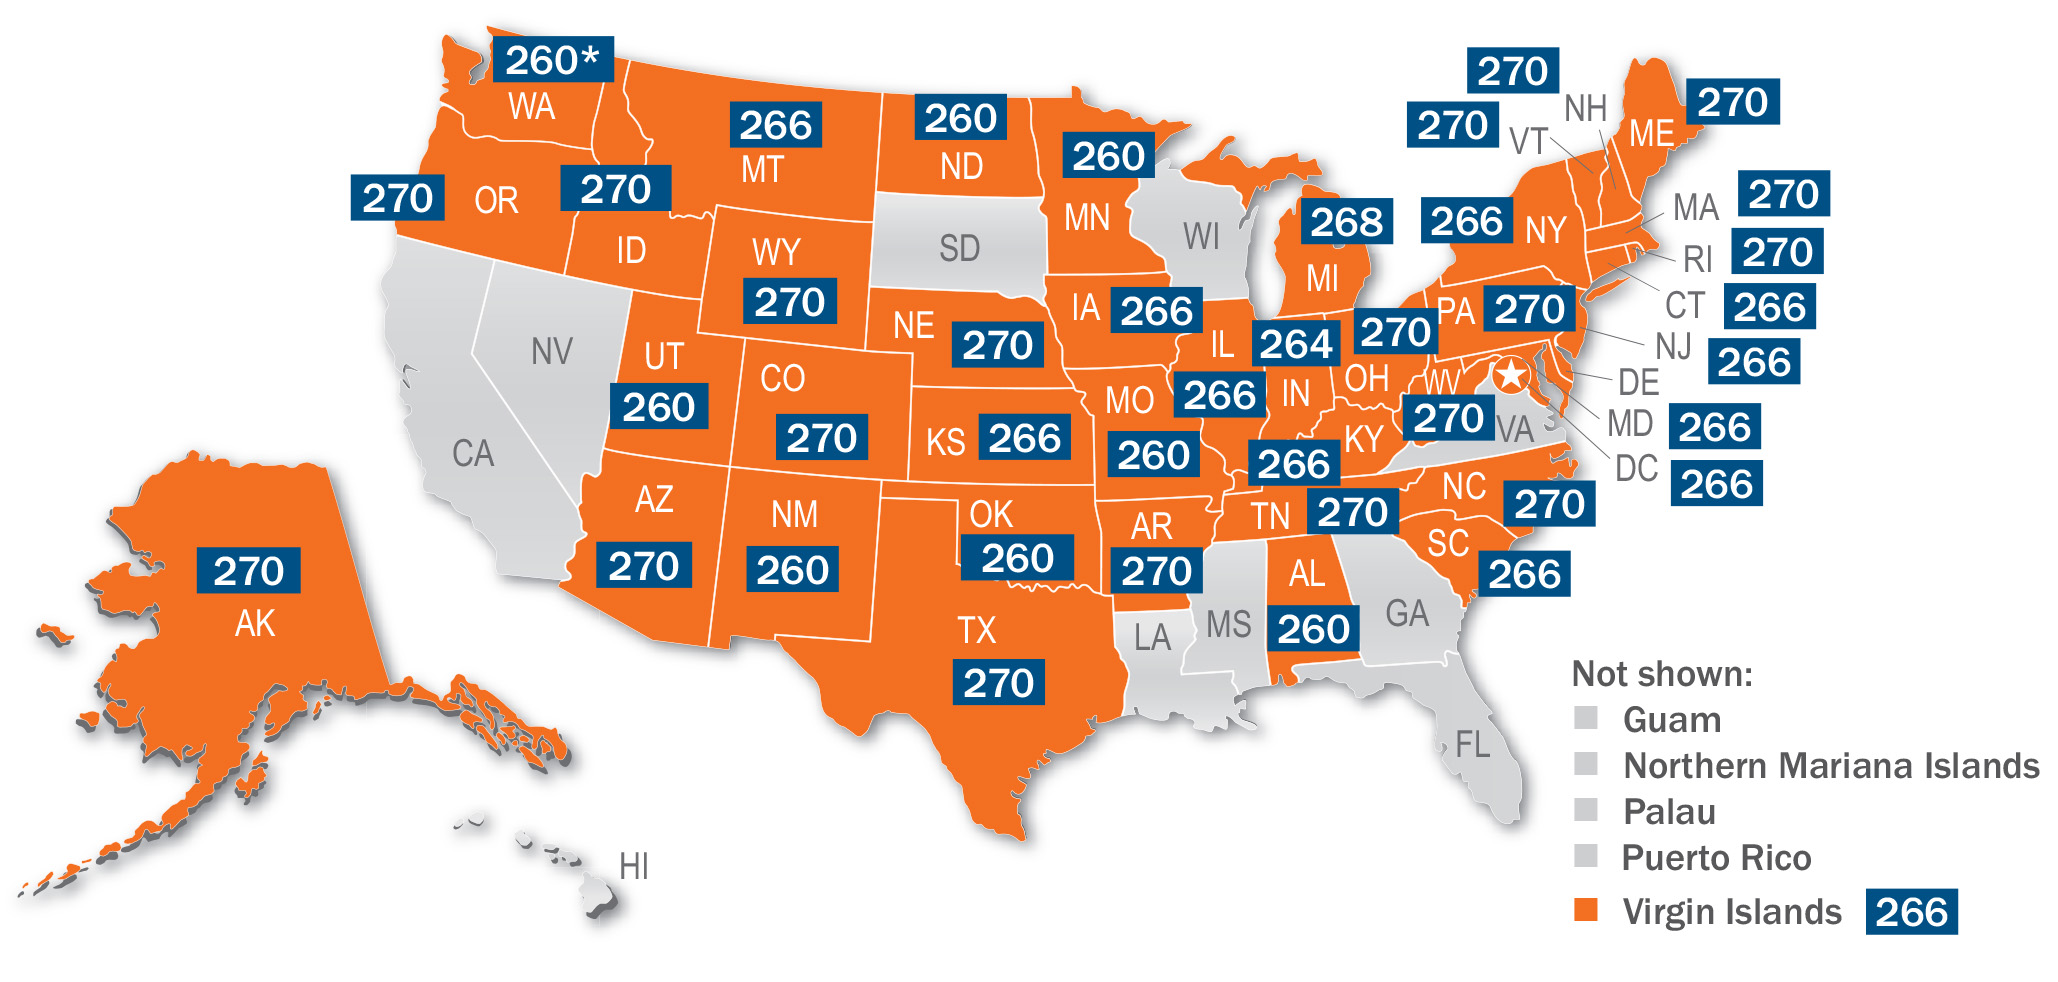
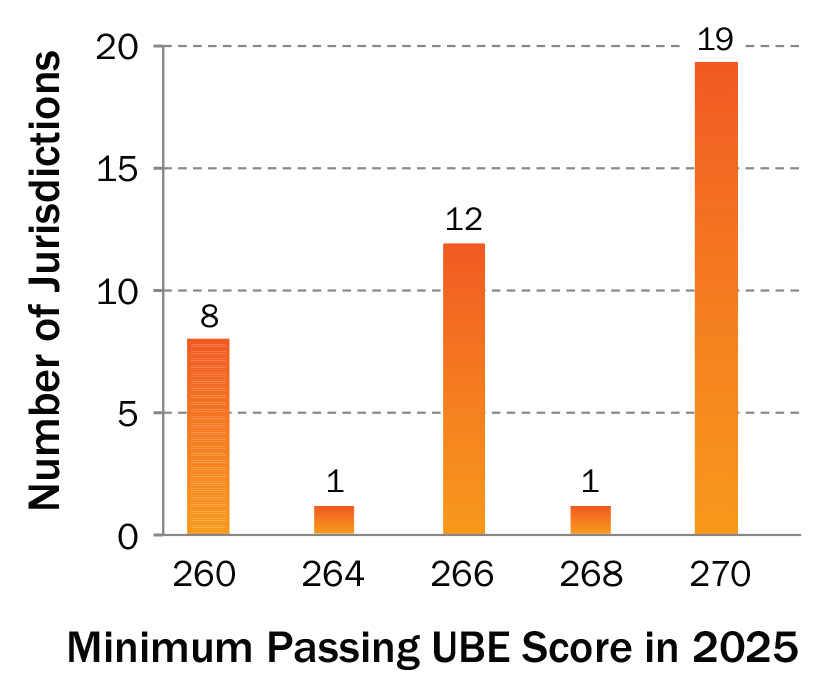
Minimum Passing UBE Score by Jurisdiction in 2025
| ID | Minimum Passing UBE Score in 2025 | Jurisdiction(s) |
|---|---|---|
| 1 | 260 | Alabama, Minnesota, Missouri, New Mexico, North Dakota, Oklahoma, Utah, Washington* |
| 2 | 264 | Indiana |
| 3 | 266 | Connecticut, District of Columbia, Illinois, Iowa, Kansas, Kentucky, Maryland, Montana, New Jersey, New York, South Carolina, Virgin Islands |
| 4 | 268 | Michigan |
| 5 | 270 | Alaska, Arizona, Arkansas, Colorado, Idaho, Maine, Massachusetts, Nebraska, New Hampshire, North Carolina, Ohio, Oregon, Pennsylvania, Rhode Island, Tennessee, Texas, Vermont, West Virginia, Wyoming |
* The Washington Supreme Court reduced the passing score for the final administration in Washington State of the legacy UBE in February 2026 to 260. Any examinee who sat for the legacy UBE in Washington State between July 2020 and July 2025 and who received a score of 260–265 is now eligible to apply for admission in Washington State based on that score.”
The values in the following charts reflect valid scores available electronically as of 3/6/26.
| February | July | 2025 Overall | |
|---|---|---|---|
| Number of Examinees | 12,795 | 34,090 | 46,885 |
| Mean Scaled Score | 260.0 | 285.5 | 278.6 |
| Standard Deviation | 30.2 | 34.2 | 35.0 |
| Maximum | 360.0 | 377.0 | 377.0 |
| Minimum | 0.0 | 0.0 | 0.0 |
| Median | 260.0 | 288.0 | 279.0 |
The values in the following charts reflect valid scores available electronically as of 2/27/26.
These data represent scaled scores in increments of 10, with the exception of 180, which includes all examinees at or below 189. For example, the percentage reported for 210 includes examinees whose UBE scaled scores were between 210 and 219. Percentages may not sum to 100% due to rounding.
| ID | UBE Scaled Score | February (Mean = 260.0) — Percentage of Examinees | July (Mean = 285.5) — Percentage of Examinees |
|---|---|---|---|
| 1 | 180 | 1.0 | 0.4 |
| 2 | 190 | 1.4 | 0.4 |
| 3 | 200 | 2.3 | 0.9 |
| 4 | 210 | 4.0 | 1.5 |
| 5 | 220 | 5.4 | 2.5 |
| 6 | 230 | 8.8 | 3.8 |
| 7 | 240 | 11.6 | 5.5 |
| 8 | 250 | 14.9 | 7.7 |
| 9 | 260 | 13.1 | 7.7 |
| 10 | 270 | 13.6 | 10.3 |
| 11 | 280 | 9.1 | 10.6 |
| 12 | 290 | 5.9 | 10.9 |
| 13 | 300 | 4.0 | 11.2 |
| 14 | 310 | 2.6 | 10.0 |
| 15 | 320 | 1.5 | 8.2 |
| 16 | 330 | 0.7 | 4.7 |
| 17 | 340 | 0.2 | 2.6 |
| 18 | 350 | 0.0 | 0.9 |
| 19 | 360 | 0.0 | 0.1 |
| 20 | 370 | 0.0 | 0.0 |
The values in the following charts reflect valid scores available electronically as of 2/27/26.
| ID | Year | February | July | Year Total |
|---|---|---|---|---|
| 1 | 2021 | 10,097 | 30,409 | 40,506 |
| 2 | 2022 | 10,415 | 31,686 | 42,101 |
| 3 | 2023 | 12,665 | 32,793 | 45,458 |
| 4 | 2024 | 12,849 | 35,730 | 48,579 |
| 5 | 2025 | 12,795 | 34,090 | 46,885 |
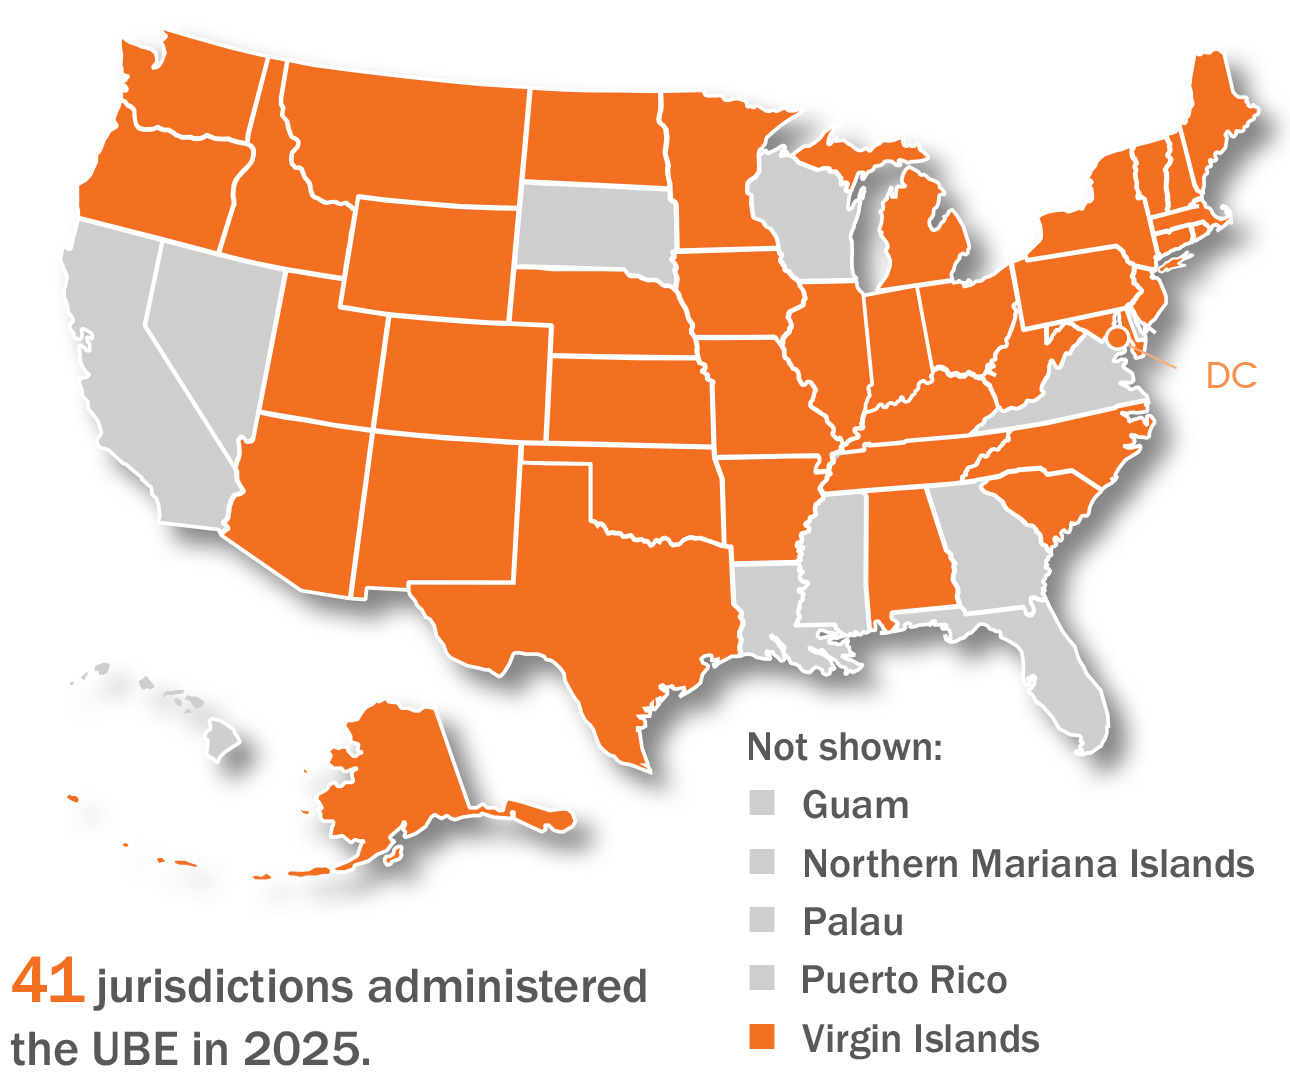
The number of jurisdictions participating in the UBE has changed over time: from 34 participating jurisdictions in February 2020 to 41 participating jurisdictions in February 2023. The number of participating jurisdictions has been steady since February 2023 through 2025.
UBE Scores Earned and Transferred by Jurisdiction in 2025
To earn UBE scores, applicants take all portions of the examination (MEE, MPT, and MBE) in the same UBE jurisdiction and in the same administration. Use of a banked, transferred, or concurrent MBE or written scaled score earned in a prior examination or concurrently in another jurisdiction does not result in a UBE score.
| ID | UBE Jurisdiction | 2025 UBE Scores Earned | 2025 Scores Transferred Out | 2025 Scores Transferred In |
|---|---|---|---|---|
| 1 | Alabama | 858 | 109 | 239 |
| 2 | Alaska | 110 | 26 | 75 |
| 3 | Arizona | 774 | 235 | 267 |
| 4 | Arkansas | 333 | 109 | 65 |
| 5 | Colorado | 925 | 316 | 358 |
| 6 | Connecticut | 619 | 160 | 325 |
| 7 | District of Columbia | 2,905 | 903 | 1,156 |
| 8 | Idaho | 179 | 86 | 89 |
| 9 | Illinois | 3,022 | 604 | 613 |
| 10 | Indiana | 623 | 125 | 326 |
| 11 | Iowa | 231 | 77 | 104 |
| 12 | Kansas | 234 | 102 | 212 |
| 13 | Kentucky | 434 | 179 | 158 |
| 14 | Maine | 206 | 93 | 72 |
| 15 | Maryland | 1,167 | 446 | 369 |
| 16 | Massachusetts | 2,022 | 868 | 406 |
| 17 | Michigan | 1,070 | 141 | 154 |
| 18 | Minnesota | 765 | 160 | 339 |
| 19 | Missouri | 828 | 384 | 435 |
| 20 | Montana | 129 | 57 | 66 |
| 21 | Nebraska | 251 | 121 | 61 |
| 22 | New Hampshire | 134 | 69 | 133 |
| 23 | New Jersey | 1,389 | 538 | 1,015 |
| 24 | New Mexico | 289 | 64 | 236 |
| 25 | New York | 14,021 | 2,273 | 1,447 |
| 26 | North Carolina | 1,199 | 432 | 304 |
| 27 | North Dakota | 85 | 42 | 63 |
| 28 | Ohio | 1,312 | 365 | 202 |
| 29 | Oklahoma | 477 | 159 | 151 |
| 30 | Oregon | 494 | 216 | 148 |
| 31 | Pennsylvania | 1,999 | 655 | 464 |
| 32 | Rhode Island | 124 | 81 | 169 |
| 33 | South Carolina | 646 | 332 | 564 |
| 34 | Tennessee | 959 | 269 | 190 |
| 35 | Texas | 4,242 | 1,158 | 661 |
| 36 | Utah | 425 | 100 | 224 |
| 37 | Vermont | 88 | 34 | 53 |
| 38 | Washington | 1,094 | 242 | 370 |
| 39 | West Virginia | 147 | 61 | 71 |
| 40 | Wyoming | 66 | 41 | 67 |
| 41 | Virgin Islands | 10 | 1 | 12 |
| 42 | Total for All Jurisdictions | 46,885 | 12,433 | 12,433 |