The Multistate Bar Examination (MBE)
The National Conference of Bar Examiners has produced the Multistate Bar Examination (MBE) since 1972.
The MBE consists of 200 multiple-choice questions in the following areas: Civil Procedure, Constitutional Law, Contracts, Criminal Law and Procedure, Evidence, Real Property, and Torts. The purpose of the MBE is to assess the extent to which an examinee can apply fundamental legal principles and legal reasoning to analyze given fact patterns.
Both a raw score and a scaled score are computed for each examinee. A raw score is the number of questions answered correctly. Raw scores from different administrations of the MBE are not comparable, primarily due to differences in the difficulty of the questions from one administration to the next. The MBE, like virtually all high-stakes exams, is equated. Equating is a statistical process that adjusts for variations in the difficulty of the questions, producing scaled scores that represent the same level of performance across all MBE administrations. For instance, if the questions appearing on the July MBE were more difficult than those appearing on the February MBE, then the scaled scores for the July MBE would be adjusted upward to account for this difference. These adjustments ensure that no examinee is unfairly penalized or rewarded for taking a more or less difficult exam. Each jurisdiction determines its own policy with regard to the relative weight given to the MBE and other scores. (Jurisdictions that administer the Uniform Bar Examination [UBE] weight the MBE component 50%.)
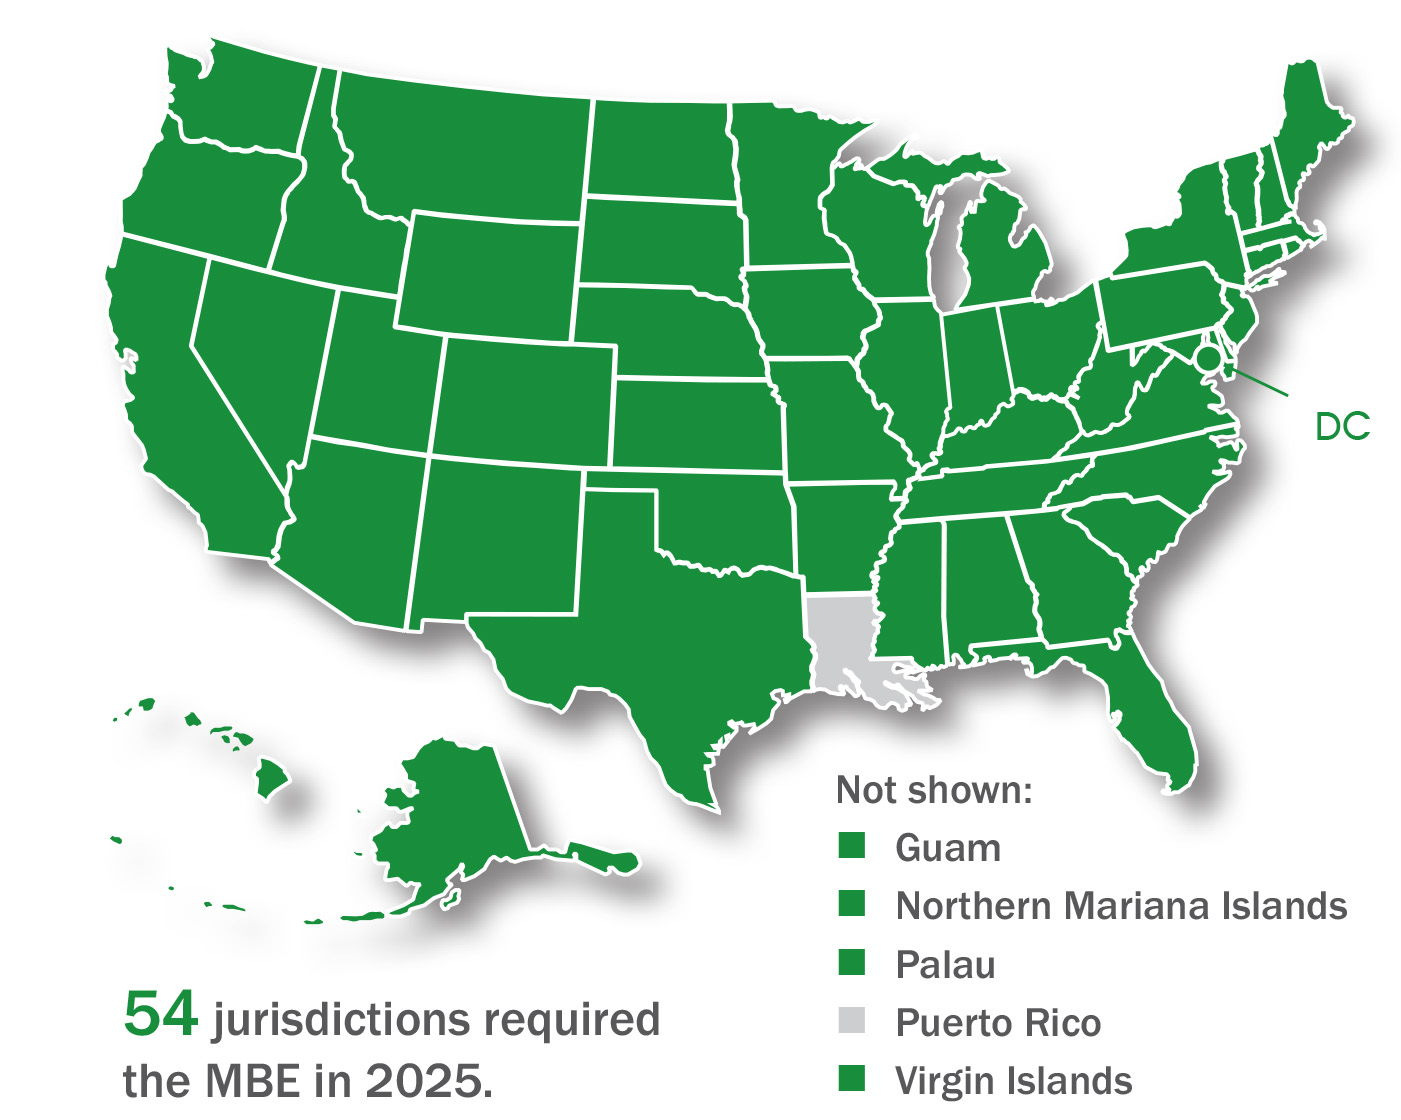
Jurisdictions Requiring the MBE in 2025
2025 MBE National Summary Statistics (Based on Scaled Scores)
The values in the following charts reflect valid scores available electronically as of 2/27/26.
| February | July | 2025 Overall | |
|---|---|---|---|
| Number of Examinees | 15,350 | 46,959 | 62,309 |
| Mean Scaled Score | 130.8 | 142.4 | 139.5 |
| Standard Deviation | 15.6 | 17.9 | 18.1 |
| Maximum | 185 | 188.7 | 188.7 |
| Minimum | 54.4 | 46.3 | 46.3 |
| Median | 130.8 | 143.3 | 139.9 |
2025 MBE National Score Distributions
These data represent scaled scores in increments of 5, with the exception of 85, which includes all examinees below that score. For example, the percentage reported for 135 includes examinees whose MBE scaled scores were between 130.5 and 135.4. Percentages may not sum to 100% due to rounding.
| ID | MBE Scaled Score | February (Mean = 130.8) — Percentage of Examinees | July (Mean = 142.4) — Percentage of Examinees |
|---|---|---|---|
| 1 | 85 | 0.2 | 0.1 |
| 2 | 90 | 0.3 | 0.1 |
| 3 | 95 | 0.6 | 0.3 |
| 4 | 100 | 1.6 | 0.7 |
| 5 | 105 | 2.4 | 1.3 |
| 6 | 110 | 4.8 | 2.2 |
| 7 | 115 | 5.9 | 2.8 |
| 8 | 120 | 8.5 | 4.4 |
| 9 | 125 | 11.8 | 6.1 |
| 10 | 130 | 13.2 | 7.7 |
| 11 | 135 | 13.2 | 9.0 |
| 12 | 140 | 11.6 | 8.8 |
| 13 | 145 | 9.2 | 10.9 |
| 14 | 150 | 5.9 | 10.3 |
| 15 | 155 | 4.5 | 9.1 |
| 16 | 160 | 3.2 | 10.0 |
| 17 | 165 | 1.8 | 6.4 |
| 18 | 170 | 0.8 | 5.6 |
| 19 | 175 | 0.5 | 2.7 |
| 20 | 180 | 0.0 | 1.2 |
| 21 | 185 | 0.0 | 0.2 |
| 22 | 190 | 0.0 | 0.0 |
| 23 | 195 | 0.0 | 0.0 |
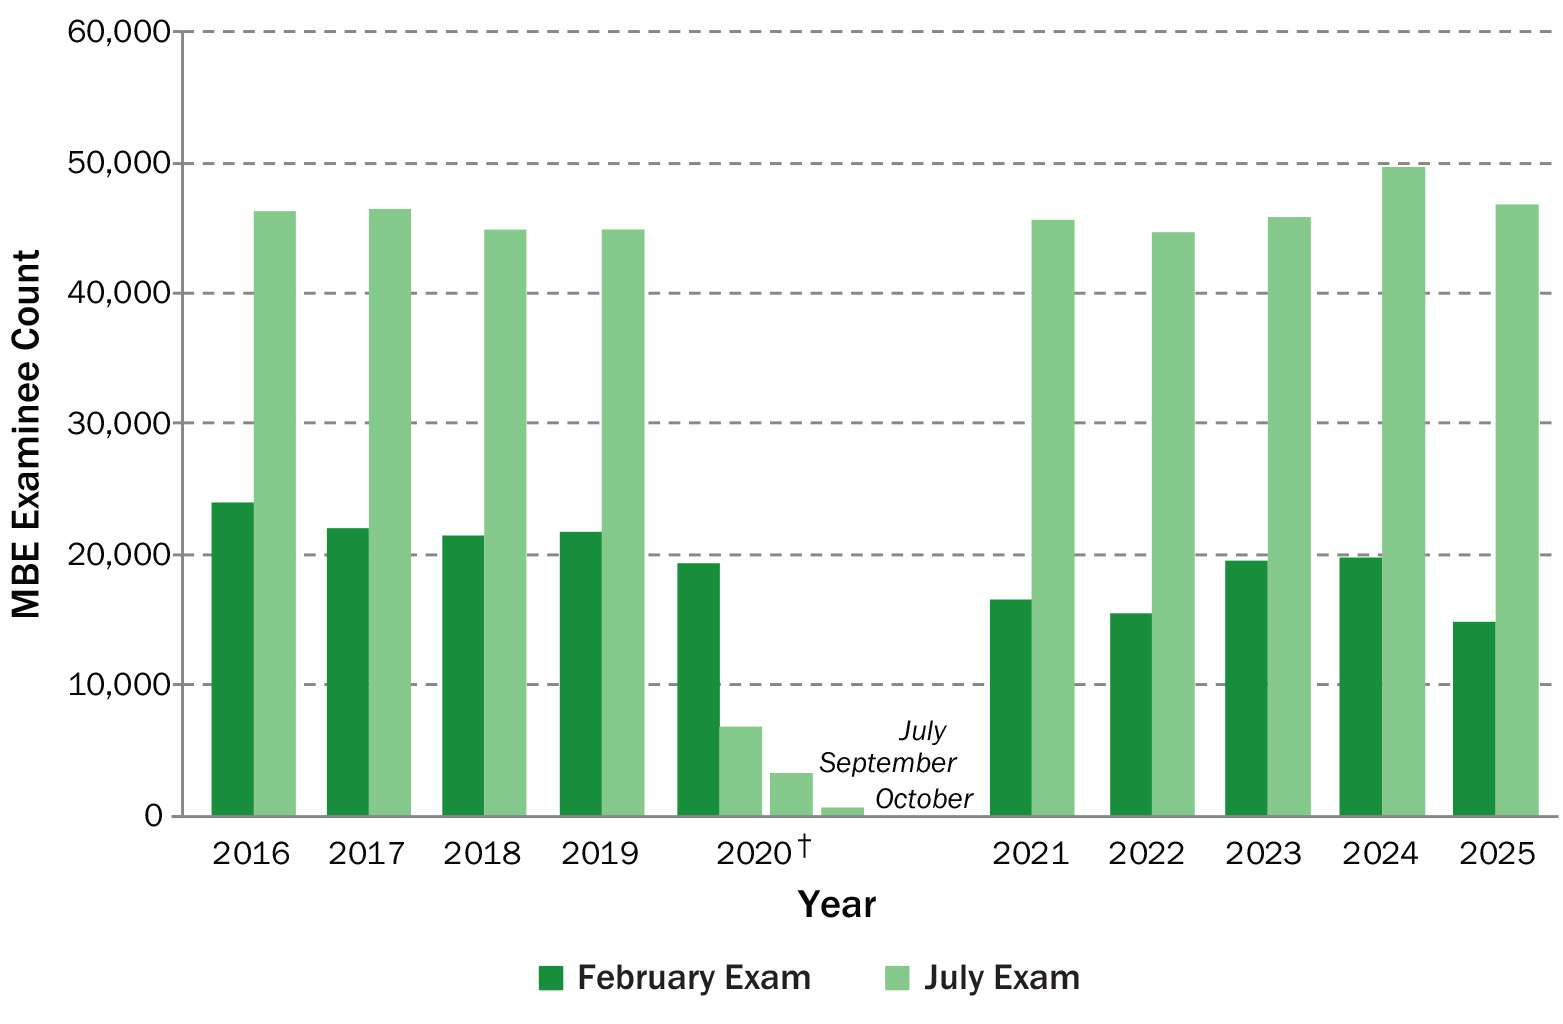
MBE National Examinee Counts, 2016–2025
The values in the following charts reflect valid scores available electronically as of 2/27/26.
| ID | Year | February | July | Year Total |
|---|---|---|---|---|
| 1 | 2016 | 23,324 | 46,518 | 69,842 |
| 2 | 2017 | 22,269 | 46,627 | 68,896 |
| 3 | 2018 | 21,111 | 45,274 | 66,385 |
| 4 | 2019 | 21,316 | 45,334 | 66,650 |
| 5 | 2020 | 19,122 | 5,678 July
1,811 September 417 October |
27,028 |
| 6 | 2021* | 16,759 | 45,872 | 62,631 |
| 7 | 2022 | 16,504 | 44,705 | 61,209 |
| 8 | 2023 | 19,228 | 45,968 | 65,196 |
| 9 | 2024 | 19,496 | 49,844 | 69,340 |
| 10 | 2025 | 15,350 | 46,959 | 62,309 |
* 161 additional examinees took a makeup multiple-choice exam in Texas in March 2021 for local admission only.
MBE National Mean Scaled Scores, 2016–2025
Note: The values in the following charts reflect valid scores available electronically as of 2/27/26.
| ID | Year | February | July | Year Overall |
|---|---|---|---|---|
| 1 | 2016 | 135.0 | 140.3 | 138.5 |
| 2 | 2017 | 134.1 | 141.7 | 139.2 |
| 3 | 2018 | 132.8 | 139.5 | 137.4 |
| 4 | 2019 | 134.0 | 141.1 | 138.8 |
| 5 | 2020 | 132.6 | 146.1 July
142.7 September 137.2 October |
136.2 |
| 6 | 2021 | 134.0 | 140.4 | 138.7 |
| 7 | 2022 | 132.6 | 140.3 | 138.3 |
| 8 | 2023 | 131.1 | 140.5 | 137.8 |
| 9 | 2024 | 131.8 | 141.8 | 139.0 |
| 10 | 2025 | 130.8 | 142.4 | 139.5 |
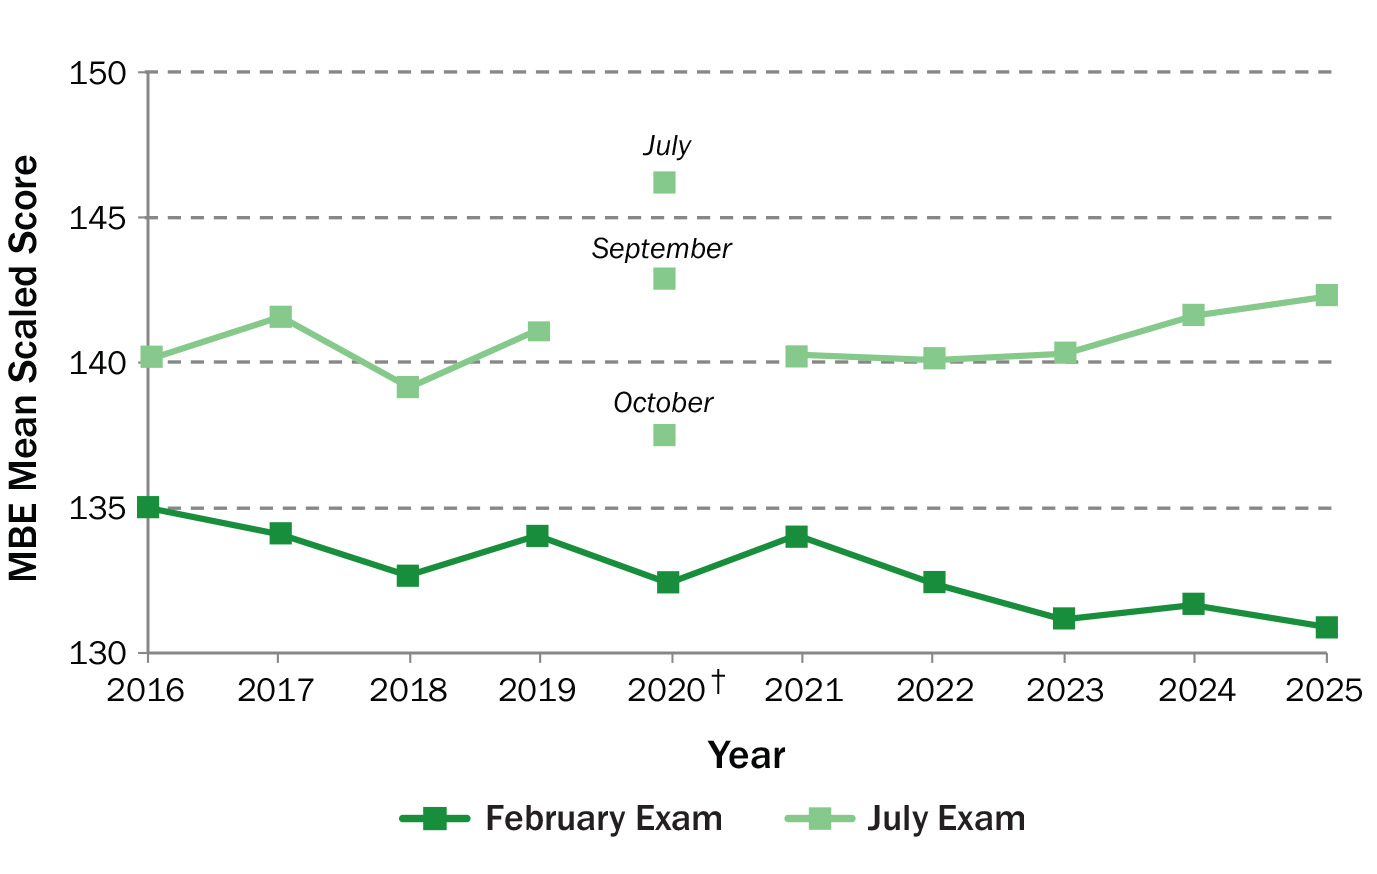
† Due to the COVID-19 pandemic, the July 2020 MBE was administered on three separate dates: July 29, September 10, and October 1. The results shown are for in-person examinees only; approximately 29,000 additional examinees sat for a remotely administered exam using NCBE materials in October 2020. Comparability to other years’ results may be limited due to the lower examinee count.