This article originally appeared in The Bar Examiner print edition, Spring 2022 (Vol. 91, No. 1), pp. 5-6.
 The MBE: Celebrating 50 Years, 1972-2022
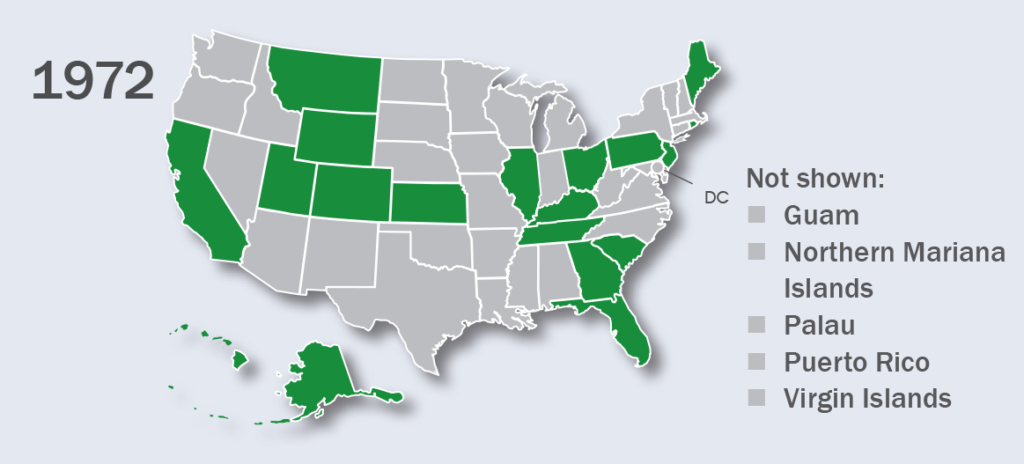
The Multistate Bar Examination (MBE) was administered for the first time in February 1972 to 4,955 examinees from 19 jurisdictions. Today, the MBE administered by 54 jurisdictions.

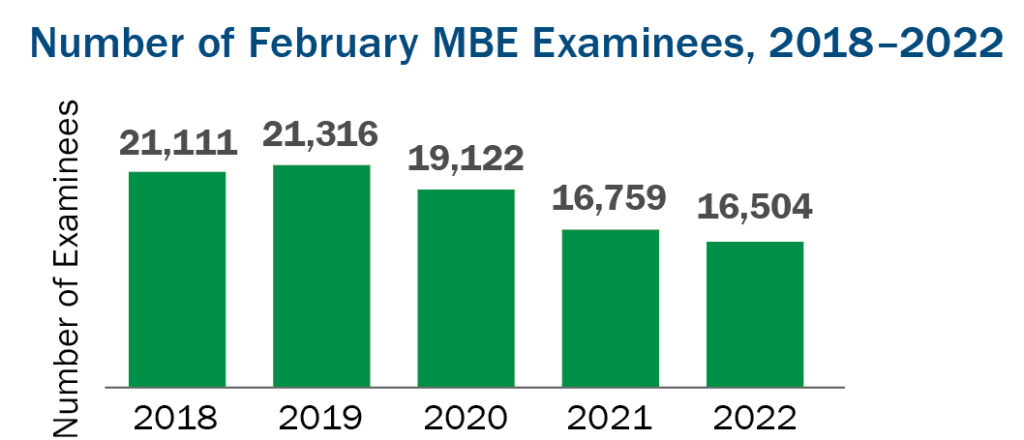
February 2022 MBE
February 2022 MBE Examinees:16,504
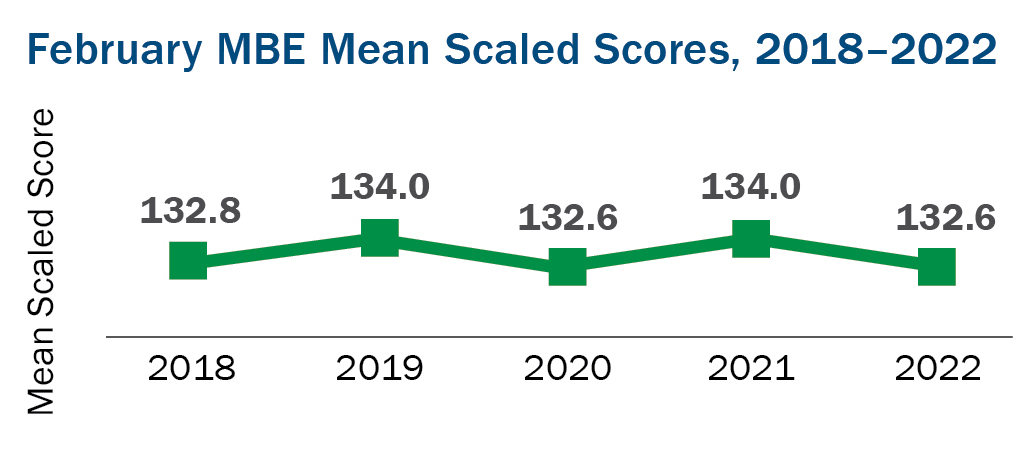
February 2022 MBE Mean Score 132.6
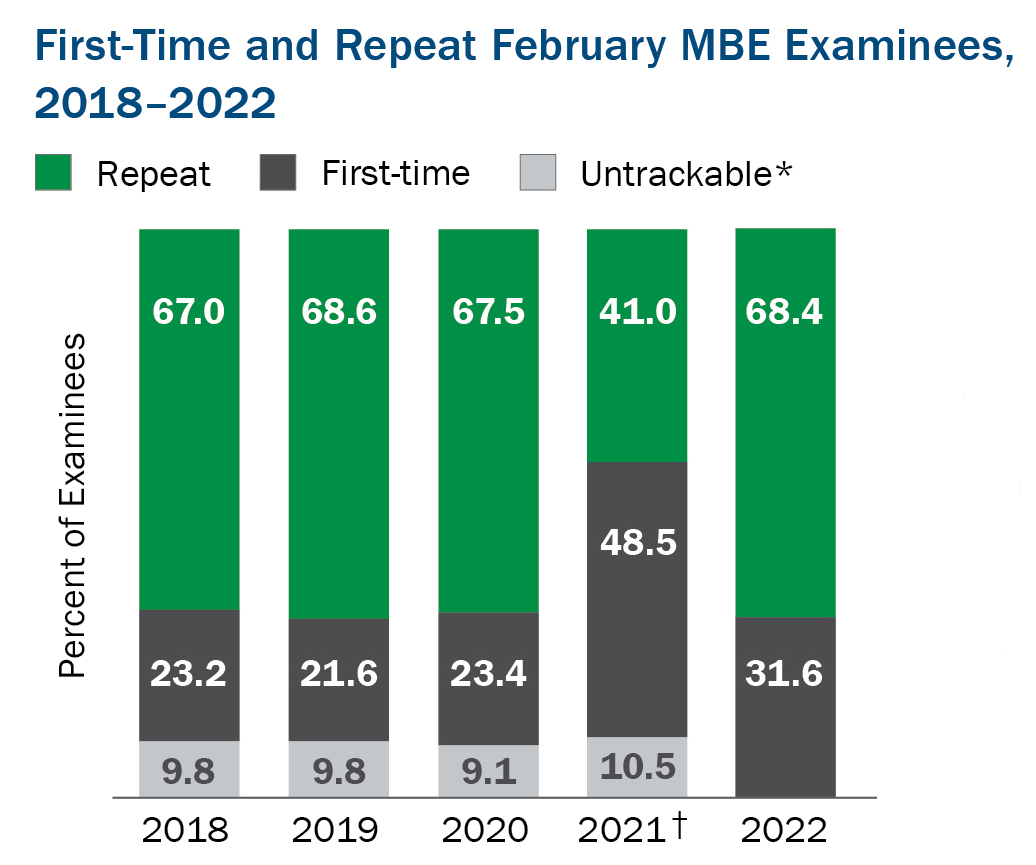
*The first-time and repeat MBE-based test taker information calculated by NCBE is an approximation based on the NCBE Number and biographic data, which has not been used consistently in all jurisdictions across time. Prior to 2022, approximately 10% of examinees were unable to be tracked with certainty by NCBE as either first-time or repeat takers due to a lack of sufficient biographic information. As of 2022, all jurisdictions have provided the necessary information for a sufficient number of administrations to allow for adequate tracking.† Because information about first-time and repeat test takers is based on whether an examinee has previously taken the MBE, attempts made by examinees who sat for an exam during the July 2020 exam cycle but did not take the full, in-person MBE are not reflected in the determination of status. As a result, it is likely that first-timer values for February 2021 are somewhat inflated and those of repeaters are depressed.
MBE Standard Deviations
|
February |
|
|
2018 |
16.0 |
|
2019 |
15.2 |
|
2020 |
15.6 |
|
2021 |
16.5 |
|
2022 |
15.4 |
MBE scores are reported on a scale ranging from 0 to 200. The values reflect valid scores available electronically as of 03/23/22.
March 2022 MPRE
March MPRE Examinees:19,206
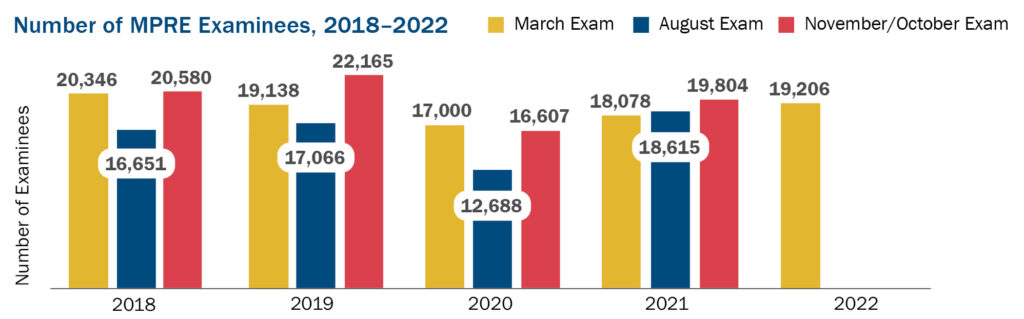 The values in this chart reflect valid scores available electronically as of 4/21/22.
March MPRE Mean Score 95.6 (score scale 50–150)
 Comparability of results may be limited due to fluctuations in examinee counts.
MPRE Standard Deviations
|
|
March |
August |
November/October |
|
2018 |
17.9 |
17.8 |
18.2 |
|
2019 |
17.9 |
17.5 |
18.3 |
|
2020 |
18.5 |
18.3 |
18.8 |
|
2021 |
18.7 |
19.1 |
19.3 |
|
2022 |
18.6 |
|
|
MPRE scores are reported on a scale ranging from 50 to 150. The values reflect valid scores available electronically as of 4/21/22.
2022 Annual Bar Admissions Conference
April 28–May 1, 2022, New Orleans, Louisiana

The 2022 NCBE Annual Bar Admissions Conference drew 291 attendees representing 53 jurisdictions, including 32 justices from jurisdictions’ highest courts and 107 first-time conference attendees.
Among the attendees were 21 speakers who presented at 15 sessions (1 keynote address, 5 plenary sessions, 8 breakout sessions, and 1 workshop) over the course of the conference.
Look for details about the conference sessions and speakers in the next issue of the Bar Examiner.
Contact us to request a pdf file of the original article as it appeared in the print edition.


