This article originally appeared in The Bar Examiner print edition, September 2015 (Vol. 84, No. 3), pp 6–15.
By Katharine W. HannaforNote: This article is derived from an article titled “A Profession in Crisis? New Results from the After the JD Study of Lawyer Careers” in Researching Law (Vol. 25, No. 2, Spring 2014), the quarterly newsletter of the American Bar Foundation, which summarized a presentation on preliminary After the JD III results given by several coprincipal investigators of the study at the Fellows of the American Bar Foundation CLE Seminar in February 2014. The quoted material in the current article draws from that presentation and from an October 2014 American Bar Foundation press release announcing the final After the JD III results. The author acknowledges contributions by Lucinda Underwood, Director of Communications for the American Bar Foundation, and Robert L. Nelson, recent former Director of the American Bar Foundation and coprincipal investigator of the After the JD study.
After the JD (AJD), a major research study of lawyer careers and the most extensive and ambitious national longitudinal study of the American legal profession ever undertaken, shines a light on the 21st-century realities of the U.S. legal profession and, by extension, the American justice system. After the JD III: Third Results from a National Study of Legal Careers is the culmination of the long-term study, which follows a nationally representative sample of lawyers who passed the bar in 2000. The study examines such factors as practice settings, income, legal education, educational debt, job mobility, race, gender, family formation (marital status, children, etc.), and the impact of the Great Recession on respondents, offering a comprehensive analysis of lawyer careers and opening the door for contemplation of the future of the profession that is a cornerstone of the U.S. legal system.1
The study, almost 20 years in the making, was funded by the American Bar Foundation, the National Association for Law Placement (NALP), the NALP Foundation for Law Career Research and Education, the Law School Admission Council (Waves 1 and 2), and the National Science Foundation. Originally suggested by members of NALP over 20 years ago, the study was intended to identify the influences on the career paths of lawyers, which would in turn help legal career services and recruitment administrators in working with young attorneys. The study surveyed the same representative group of lawyers three times over the course of 12 years and uncovered a complex picture of a profession that is changing rapidly in some respects, and yet stalled on progress in race and gender equality.
Over the course of the study, Wave I surveyed sample members in 2002–3, Wave 2 in 2007–8, and Wave 3 in 2012–13. Wave 3 surveyed the 5,527 persons who responded to either Wave 1 or Wave 2 or both. A total of 3,035 respondents completed Wave 3, for a final response rate of 55%. Wave 3 employed various methods of data collection, including online interviews, supplemented by mail surveys, and, to a lesser extent, telephone interviews. In addition, in-person qualitative interviews were conducted with a small sampling of individual respondents. The findings presented in this article are the principal and important findings to date.
Tammy Patterson, President and CEO of the NALP Foundation for Law Career Research and Education and coprincipal investigator of After the JD, explained that “from the onset of this project, the AJD research team set out to answer several important questions about legal career paths,” such as:
- What is the effect of the legal education experience on a lawyer’s first job choice and salary?
- Do factors such as law school experience, social networks, and academic performance differentially affect men and women and majority and minority groups in their career paths?
- How do individuals’ legal training, social networks, and personal contacts affect their job choices and mobility?
- What are the effects of starting income on later job choices and mobility?
- How satisfied are new bar admittees with their career choices?
- How many lawyers are leaving the practice of law, and what are their reasons for doing so?
“However,” said Patterson, “the one question not contemplated in the original scope of the project, but afforded to our research team as a result of the economic downturn in the late 2000s, is how a recession would affect jobs, careers, and financial considerations of lawyers. The findings obtained around the economic and professional impact of the recession will serve the profession for years to come.”2
The Class of 2000: Where Are They Now? Lawyer Practice Settings
In sectors of law practice—private, public, business, and other—findings show that young lawyers worked less and less in private law practice over the last 12 years. Correspondingly, in the same time period, the percentage of lawyers working in business and government grew. (See Figure 1, in which government is included in the public sector.) The movement of young lawyers out of private practice was not limited to those working in large law firms (firms of 101 or more lawyers).
Figure 1: Sectoral distribution by wave

According to Ronit Dinovitzer, Associate Professor of Sociology at the University of Toronto and coprincipal investigator of After the JD, “all of the firm settings experienced contraction at almost the same rate.”3 In the growing business sector, the lawyers were working in jobs where some were and some were not practicing law. Specifically, in Wave 3, 12.6% of young lawyers were in business practicing law, and 7.4% were in business not practicing law. Many of the cohort were not practicing law in other settings as well. For example, 28.2% of those working in the federal government were not practicing law. Overall, by Wave 3, 19.2% of the studied lawyers were working in settings where they were not practicing law.
The study delves into the relationship of the type of law school attended to the job settings in which the cohort began their careers, and what happened to them over time. While graduates of the Top 10 law schools were more likely to start out in a very large firm (a firm of over 251 lawyers), over time they migrated out of those firms. In Wave 1, 55.3% of top law school grads worked in firms of over 251 lawyers; in Wave 2 the percentage dropped to 28.7%, and in Wave 3 to 15.6%. Graduates of Tier 3 law schools, though starting out in much smaller numbers in very large law firms, showed more stability, on the other hand. Nearly 8% of Tier 3 law school graduates worked in very large firms in Wave 1; 9.6% in Wave 2; and 7.9% in Wave 3.
Gender
The study raises provocative questions on gender, focusing on women’s employment: Is there evidence of women opting out of the legal profession? Are they disappearing from the labor force, particularly as they start to have children? The evidence does not yet show a clear trend. In Wave 2, a little less than 10% of the women reported not being employed; by Wave 3 that number had gone down slightly to 8.6%. In Wave 2, 14% of the women said they were working part-time; by Wave 3 that number had gone up only slightly, to 15.3%. (See Figure 2.) The Wave 3 study also compares sectors in which men and women were employed 12 years into their careers. Again, the movement of lawyers into the business sector was apparent—about 20% of both male and female lawyers were working in business by Wave 3, continuing a trend that had already been established by Wave 2, by which 18.9% of both male and female lawyers were working in business. (Wave 3 only showed a slight decline in those working in business but not practicing law, from 7.9% in Wave 2 to 7.4% in Wave 3.)
Figure 2: Labor force participate by gender and wave
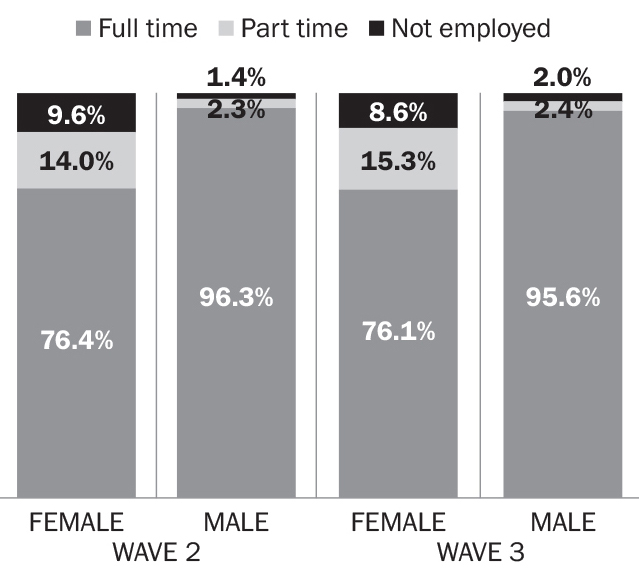
Overall, 10% of the women and 13.1% of the men were working in firms of over 100 lawyers, and about 10% of the men and of the women were working in solo practice. Slightly more women than men were working in government—19.6% for women and 16.3% for men. In Wave 3 more women than men (8.2% versus 4.4%) were working in the nonprofit education sector.
Race
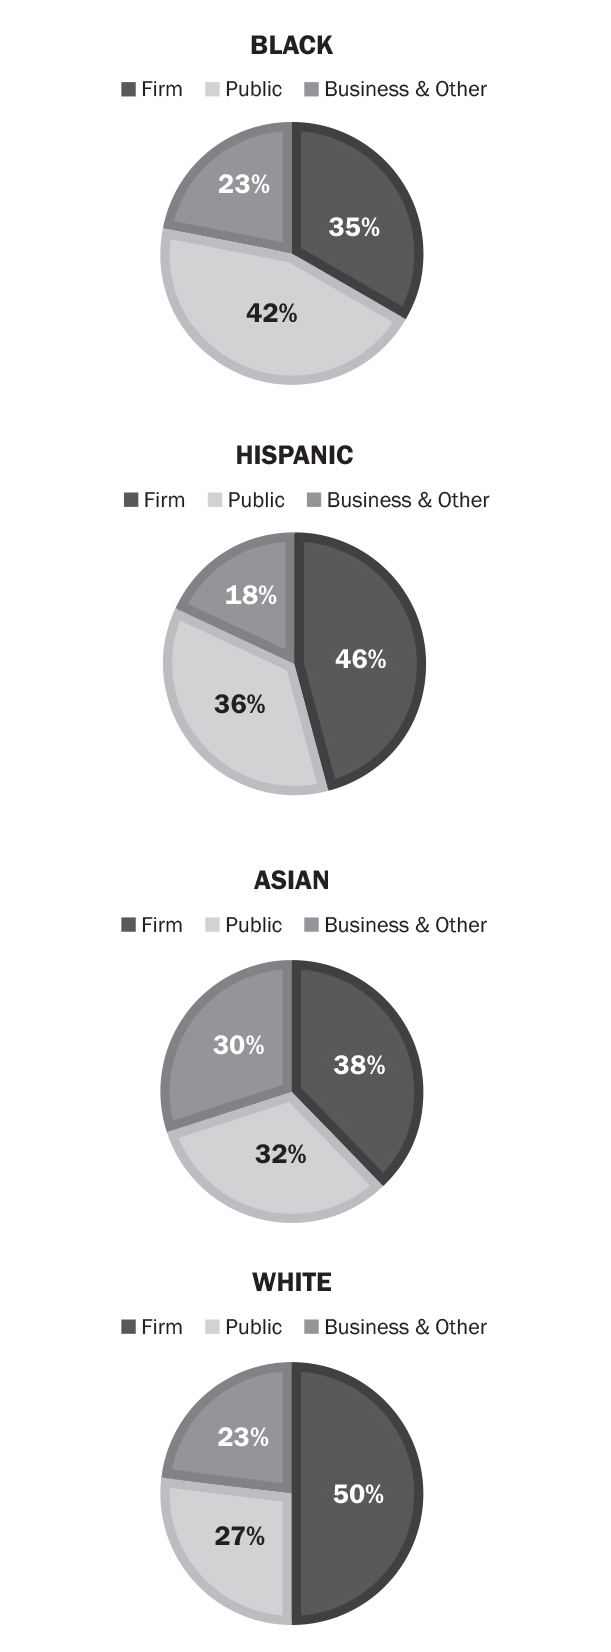
The study provides an analysis of labor sectors by race, focused mainly on the four major racial groups commonly identified in the United States (black, Hispanic, Asian, white). Strikingly, the study shows that blacks’ and whites’ work patterns were almost exact opposites in Wave 3. Only 35% of blacks worked in private practice compared with 50% of whites. At the same time, blacks were most likely to work in the public sector (42%), while whites were the least likely of all four groups (27%). (See Figure 3.) Hispanics and whites were the most represented in the largest law firm sector (11.3% and 12.1% respectively).
Figure 3: Wave 3 sectors by race
The movement of lawyers out of private practice and into business and other settings was also seen across racial groups. Blacks in particular moved out of solo and small firm practice and into business practicing law. Between AJD Waves 2 and 3 there was a 25.2% drop in black lawyers in solo practice, a 26.4% drop in black lawyers in small firm practice, and a 62.6% increase in black lawyers practicing in business. (See Table 1.)
Table 1: Percent Change in Practice Settings by Race, Wave 2, Wave 3
"Forbidden"
A Movement Out of Law Practice
The study looks at the demographics of those in the cohort not practicing law. In Wave 1 (2002–3), 14.7% of all respondents were not practicing law; in Wave 2 (2007–8), the percentage grew to 21.4%; by Wave 3 (2012–13), the percent of the cohort not practicing law had dropped slightly to 19.2%. (See Figure 4.) The movement out of practicing law was true for both men and women, though women seemed to be moving out at a higher rate. By Wave 3, 19.9% of the women were not practicing law, compared to 18.6% of the men. David B. Wilkins of Harvard Law School, another coprincipal investigator of the study, suggests that these figures probably indicated women confronting “whether a legal career is consistent with having a family life” as they approached the age of 40.4
Figure 4: Percent practicing law and not practicing law by wave (weighted national sample)

The relationship of law school tier and the movement of young lawyers away from practicing law again figures into the picture of this cohort. Between Waves 1 and 2 there was a very large jump in the percentage of graduates of the Top 10 law schools not practicing law (from 8.7% in Wave 1 to 21.8% in Wave 2). Graduates of the remaining law school tiers moved out of practicing law at a steadier rate, across AJD Waves 1 through 3. However, by Wave 3 graduates of the lowest tier of law schools (Tier 4) represented the highest percentage not practicing law, at 21.4%.
What Are They Earning? Who Makes Partner?
Wave 3 examines lawyers’ earnings at 12 years into their careers. Overall, among those working full-time, the median income for men was higher than that of women—$132,000 for men versus $106,000 for women. The gender gap has grown with each of the three waves of the AJD study. Among the highest full-time earners—those at law firms of over 251 lawyers—the median income was $290,000 for men and $191,000 for women. In the category of “business, not practicing,” the gender gap was large—a median income of $145,000 for men and $100,000 for women. (See Table 2.)
Table 2: Wave 3 Median Income by Gender (Full-time Only)
File "/var/www/vhosts/thebarexaminer.ncbex.org/httpdocs/wp-content/uploads/Table-2_-Wave-3-Median-Income-by-Gender-Full-Time-Only-2.xlsx" does not exist.
When income is analyzed in terms of race and ethnicity, a few trends are revealed. On a positive note, in Wave 3, blacks, Asians, and whites at firms of 101 or more lawyers earned a median income of $224,000 (blacks) to $225,000 (Asians and whites). (Hispanics in firms of this size had lower median earnings of $195,000.) When examining median incomes among solo practitioners, it is worth noting that Hispanics and Asians have higher median incomes than blacks or whites. (See Table 3.) Following up on this finding, the AJD researchers have conducted qualitative interviews and have discovered that many of the Asian and Hispanic solo practices are “language specific.” Possessing language skills in an Asian language or Spanish, an attorney can build a niche practice that “can turn into quite a prosperous solo career,” observes Bryant G. Garth, Chancellor’s Professor of Law at the University of California Law School at Irvine and another lead researcher of the AJD team.5
Table 3: Wave 3 Race Median Earnings by Setting (Solo and Private firms, Full-Time Only)
"Forbidden"
Grades across the law school tiers and their relationship to lawyer income also come into play in this cohort. As one moves from more to less selective schools, grades become more important for larger earnings, the study showed. Among the Top 10 and Top 20 law schools, grades were somewhat less important for higher earnings.
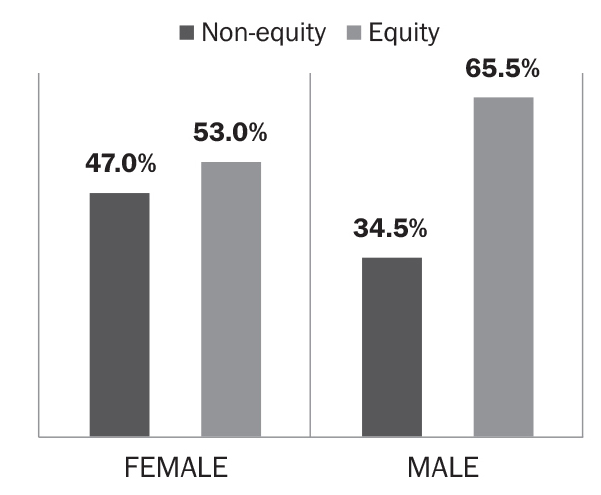
Yet another salient aspect of the study is partnership and its relation to gender. In private practice in Wave 3, 66% of the men were partners, compared to 52% of the women. Of the male partners in the sample, 65.5% had equity status by Wave 3, compared to only 53% of the female partners. (See Figure 5.) Says Garth, “The partnership distribution in private practice is highly, highly skewed.” 6
Figure 5: Wave 3 partnership status among partners in private law firms by gender
Educational Debt
The financial debt that many lawyers carry is an issue in the national conversation about whether law school is a good investment or not. In the study, both women and men started their careers with a median debt of about $70,000. By Wave 3, law school debt had been reduced to a median of $50,000 for both genders. Also, by Wave 3, close to 47% of women and 48% of men had paid off all of their educational debt. (See Table 4.) Across all gender and racial groups, by Wave 3, 47.4% of the cohort had paid off their debt. (See Table 5.)
Table 4: Median Educational Debt Remaining by Gender (Weighted National Sample)
"Forbidden"
Table 5: Median Educational Debt Remaining by Race (Weighted National Sample)
"Forbidden"
Big differences in debt level appear when race is brought into the analysis, however. At the beginning of their careers, blacks and Hispanics had the highest median debt (black: $72,000; Hispanic: $73,000; Asian: $60,000; white: $70,000). By Wave 3, 60.1% of Asians and 48.4% of whites had paid off their debt completely, whereas only 30.4% of Hispanics and 23.3% of blacks had done so. In Wave 3 as well, blacks, at 7.3%, and Hispanics, at 15.5%, were the groups most likely to still be over $100,000 in debt. (See Table 5.) At least some of this difference may be a reflection of the ability of parents to help pay off their children’s debt. When debt was analyzed in relation to tier of law school attended, it was clear that those who had graduated from a Top 10 law school were least likely to have debt remaining in Wave 3. As the tier of law school attended declined, the amount of debt remaining rose.
Career Satisfaction
Overall, in Wave 3, respondents were mostly satisfied with their decision to become a lawyer, the researchers found. In 2012, respondents rated their satisfaction with their decision to become a lawyer at an average of 3.92 on a 1-to-5 scale. By digging deeper into these data and examining lawyers’ practice settings, the researchers were able to learn more about the most and least satisfied lawyers. The most satisfied overall were those working as public interest lawyers; the least satisfied overall were those working in business but not practicing law. The Wave 3 results also showed higher than average levels of satisfaction with the substance of their work and with their opportunities for advancement among solo practitioners.
When Wave 3 respondents were asked whether they thought law school had been a good investment, the average response was 5.55 on a 1-to-7 scale. When asked whether they would go to law school if they had to do it over again, the average response was 4.91 on a 1-to-7 scale. The largest percentage of respondents answering “7” (that is, most enthusiastic about going to law school again) were from the Tier 3 and Tier 4 schools, suggesting, says Garth, that “often those who are most satisfied with their decision to go to law school . . . are those who have come the farthest,” both economically and socially. 7
The Impact of the Recession of 2008–9
In Wave 3, the researchers were able to query the cohort about the effects of the economic recession of 2008–9. While 2008–9 was a very difficult time to start a law career, those already working as lawyers, as was true of most of the cohort, weathered the recession reasonably well. To the surprise of the researchers, 40.6% of the women and 41% of the men in Wave 3 claimed that the recession had “no noticeable impact” on their livelihoods or work lives when they were queried in 2012.
Without doubt, however, some negative effects were felt by the cohort. For example, 22.4% reported that their compensation had been reduced. The economic upheaval contributed to job mobility as well, as 11% of the women and 12.2% of the men reported changing jobs as a result of the recession. Almost 10% of both men and women reported that the recession had affected their ability to repay their law school loans, while almost 9% reported not being able to meet their billable hours requirement due to a reduced workflow. On the positive side, however, only 4.9% reported being laid off as a result of the recession, and as few as 2.6% reported the recession as causing them to leave the legal profession altogether.
Conclusion
According to Robert L. Nelson, recent former Director of the American Bar Foundation, Professor of Sociology and Law at Northwestern University, and coprincipal investigator of the AJD study, “This third report provides unique insights into the evolution of lawyers’ careers. We see the persistence of inequalities by race, class, and gender played out over careers.” Nelson noted specifically that people of color, and especially women of color, are less likely to have made partner in private law firms, the most remunerative sector of the profession. He added, “Women are far more likely than men to be unemployed or working part-time, and even full-time women attorneys make 80% of what male attorneys make. Moreover, 12 years into careers, where one went to law school has a profound influence on where one practices.”8
According to James G. Leipold, Executive Director of NALP, “This study is of enormous importance, particularly at this time when there are so many fundamental questions about the value of legal education. Despite challenges faced as a result of the recession, the lawyers in this cohort continue to express very high levels of satisfaction with their decisions to become lawyers.” He noted, “I would expect to see trends identified by this research to continue to manifest themselves, particularly the very high level of job mobility in the first five years of practice. It is no longer the case that a law school graduate can expect to spend an entire career with a single legal employer. And finally, these study results should serve as a wake-up call for the industry—the disparities in outcome for women and minority attorneys are in some ways quite shocking.”9
Notes
- The study was led by Robert L. Nelson, recent former Director of the American Bar Foundation, MacCrate Chair in the Legal Profession at the American Bar Foundation, and Professor of Sociology and Law at Northwestern University; Terry Adams, University of Michigan Institute for Social Research (retired); Ronit Dinovitzer, Associate Professor of Sociology at the University of Toronto and Faculty Fellow at the American Bar Foundation; Bryant G. Garth, Chancellor’s Professor of Law at the University of California Law School at Irvine and Affiliated Research Professor at the American Bar Foundation; John L. Hagan, Research Professor at the American Bar Foundation and John D. MacArthur Professor of Sociology and Law at Northwestern University; Tammy Patterson, President and CEO of the NALP Foundation for Law Career Research and Education; Dr. Gabriele Plickert, Research Social Scientist at the American Bar Foundation (now at Texas A&M University); Rebecca Sandefur, Associate Professor of Sociology at the University of Illinois and Faculty Fellow at the American Bar Foundation; Joyce Sterling, Professor of Law and Associate Dean of Faculty Scholarship at the University of Denver Sturm College of Law; and David B. Wilkins, Lester Kissel Professor of Law and Director of both the Program on the Legal Profession and the Professional Services Industry Center at Harvard Law School. The full report from Wave III, After the JD III: Third Results from a National Study of Legal Careers, is available for purchase through the NALP Foundation online bookstore at http://www.nalpfoundation.org/bookstore. (Go back)
- Tammy Patterson, quoted in “Major New Research Study on Lawyer Careers Reveals a Changing Profession, but Little Progress on Race and Gender Equality” (American Bar Foundation press release, Chicago, IL, Oct. 24, 2014). (Go back)
- Ronit Dinovitzer, comments at the Fellows of the American Bar Foundation CLE Seminar, “A Profession in Crisis? New Results from the After the JD Study of Lawyer Careers” (Chicago, IL, Feb. 8, 2014). (Go back)
- David B. Wilkins, comments at the Fellows of the American Bar Foundation CLE Seminar, “A Profession in Crisis? New Results from the After the JD Study of Lawyer Careers” (Chicago, IL, Feb. 8, 2014). (Go back)
- Bryant G. Garth, comments at the Fellows of the American Bar Foundation CLE Seminar, “A Profession in Crisis? New Results from the After the JD Study of Lawyer Careers” (Chicago, IL, Feb. 8, 2014). (Go back)
- Id. (Go back)
- Id. (Go back)
- Robert L. Nelson, quoted in “Major New Research Study on Lawyer Careers Reveals a Changing Profession, but Little Progress on Race and Gender Equality” (American Bar Foundation press release, Chicago, IL, Oct. 24, 2014). (Go back)
- James Leipold, quoted in “Major New Research Study on Lawyer Careers Reveals a Changing Profession, but Little Progress on Race and Gender Equality” (American Bar Foundation press release, Chicago, IL, Oct. 24, 2014). (Go back)
 Katharine W. Hannaford is Senior Writer for the American Bar Foundation.
Contact us to request a pdf file of the original article as it appeared in the print edition.