This article originally appeared in The Bar Examiner print edition, March 2017 (Vol. 86, No. 1), pp 4–13.
By Erica Moeser It’s that time of year when statistics from the prior year come raining down like April showers. Over the years the history of bar admissions has been written through the efforts of the many bar admission administrators who faithfully supply the grist that makes this issue of the Bar Examiner possible. Just as there is no better source on requirements for bar admission than the Comprehensive Guide to Bar Admission Requirements that we publish annually in cooperation with the American Bar Association, there is no better source—actually no other source—for the statistical information about the state of bar admissions than that contained in every March issue of this publication.
Both this magazine and the Comp Guide, as we call it, are available on our website, broadly available as no paper publication could ever be. The NCBE staff, and especially our Editor, Claire Guback, and our Graphic Designer, Amy Kittleson, deserve great credit for developing and delivering these resources to the public.
The statistics tell a story with which we have become all too familiar. The group of law school graduates who comprised a large percentage of the July 2016 test-taking cohort entered law school in 2013. That law school class, totaling 39,659, represented a contraction of 12,447 students from the class that entered in 2010 that I have been using as a baseline: it numbered 52,106. The 2013 entering class’s performance on the July 2016 examinations was more encouraging than it might have been, thanks (I suspect) to the energy and creativity at some law schools that are putting shoulders to the wheel following the rude awakening that occurred when July 2014 results were announced.
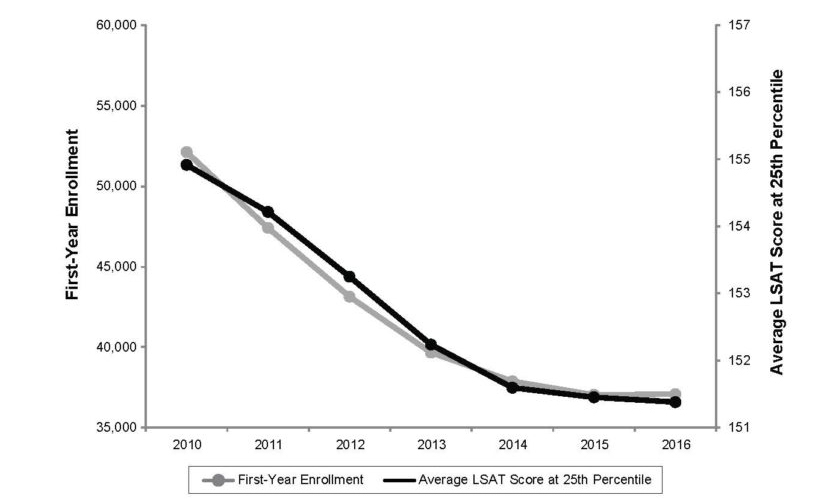
The charts I have included in previous columns showing data as supplied by the ABA and the Law School Admission Council for first-year enrollment and LSAT score at the 25th percentile since the 2010 entering class are shown below. The charts are modified for this issue: I have eliminated two years’ worth of data—from 2011 and 2012—in order to retain a readable font size and to limit consideration to the matters discussed below.
As noted, 2010 serves as a baseline because of its abundance of first-year law students. This class presented LSAT credentials that reflected an era of greater selectivity in law school admissions. (This should not be taken to mean that the LSAT is the only credential that law schools used to admit students. It is merely an indicator.) The class that entered in 2013 is included because many students from that group took the July 2016 bar examinations recorded in this issue’s statistics.
The class that entered in 2014 is of interest because the graduates of that class are in the batter’s box for the July 2017 bar examinations. 2014 marks the last year of significant slide in first-year enrollment (minus 1,696), after which the numbers flattened out, to everyone’s relief. And the numbers from the most recent entering classes, from fall 2015 and 2016, allow us to speculate beyond the July 2017 tests and observe if schools are stabilizing enrollments and LSAT indicators now that it appears that the steep declines in enrollment nationally have eased.
There is, of course, more sophisticated analysis necessary. Not all first-year students at a particular law school finish at that school, finish in three years, or—for that matter—finish at all. Studies have found that rank in the law school class is usually a better predictor of success on the bar examination than the LSAT score. Still, when one considers that the MBE covers subject matter that is often part of the core curriculum offered during the first year of law school, and that the LSAT has been validated against first-year grades, it should come as no surprise that there is a meaningful relationship between LSAT scores and bar passage.
The charts are arranged by jurisdiction to show the actual numbers of 1L students enrolled and the LSAT score reported as the top of the bottom quartile of the class. (We know of no data available that would show how low LSAT scores reach at the tail of the curve.) The columns expressing percentage change present both the overall change from the bumper-crop year to the most recent one reported (2010–2016), and also the year-to-year change for the two most recent years (2015–2016).
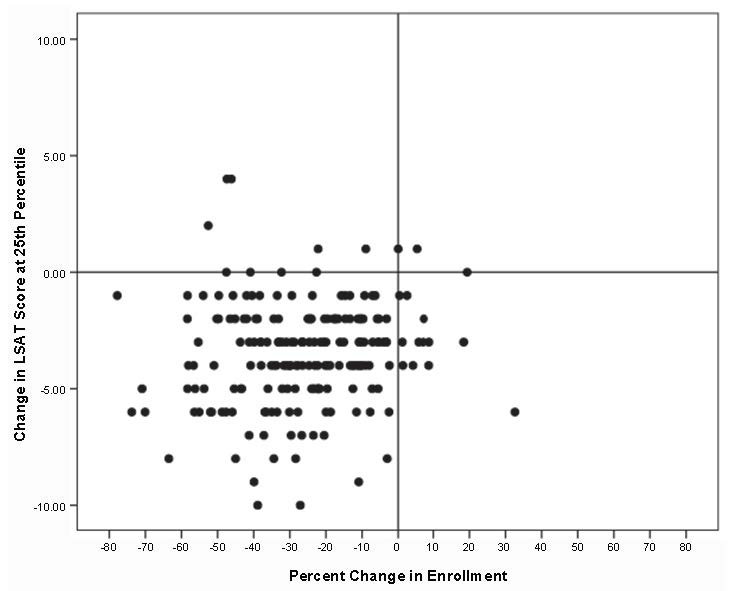
Two graphics are also presented to show the trends since 2010. The scatterplot shown below expresses the falloff in enrollment that has been coupled with a decline in LSAT scores at the 25th percentile. The accompanying graph shown below relates the two factors.
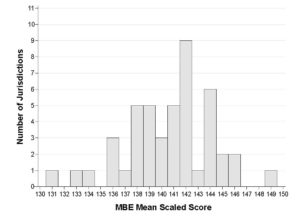
Two bar graphs shown below. The first reveals the variation in MBE mean scores across jurisdictions in July 2016. Accounting for the variations is a complex task for which data is largely unavailable. It is the individual mean in every jurisdiction to which the written portion of the examination is scaled. The second bar graph captures the range of cut scores (that is, pass/fail points) selected by jurisdictions for the July 2016 examination.
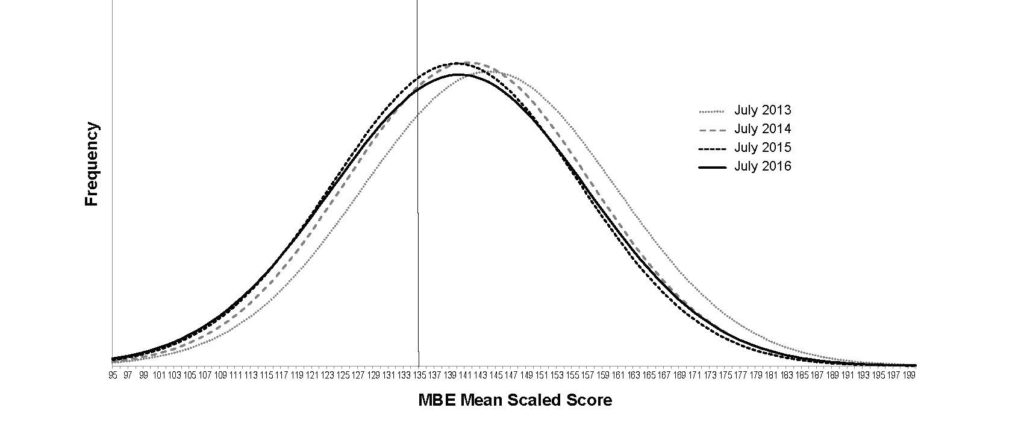
Finally, a representation of the shift of bell curves shown below shows the gradual decline in performance on the MBE from July 2013, when the bumper crop that entered law school in 2010 graduated and tested, through July 2016.
Hearty thanks go to Dr. Joanne Kane and Dr. Andrew Mroch of the NCBE staff for their development of these graphic expressions.
Other interpretations are left to the reader. Every jurisdiction tells its own story with its own suite of applicants, who may or not be graduates of its own institutions. We know that mean scores on the MBE vary by jurisdiction, and that those numbers are driven, at least in part, by graduates of local schools. As a final note, February numbers reflect a larger percentage of candidates repeating the bar examination in the jurisdiction where they tested originally than we see in July. A falloff on any July examination compels an uptick in February numbers.
Of course, there is other news at NCBE. We are gearing up for our largest and most ambitious Annual Bar Admissions Conference ever. This May we are meeting in San Diego. We have over 400 registrants—a record. We are offering more breakout sessions and otherwise turning ourselves inside out to make this a worthwhile educational event for the bar examiners, bar administrators, and state Supreme Court justices who will attend.
As this issue goes to press, we are in the aftermath of the February bar examinations. The weather gods—always threatening to be a bit fickle—smiled on us this year, and there were no blizzards or power outages to liven things up at the test sites. Scoring is under way and on schedule.
And finally—drum roll—it gives me great pleasure to announce that Maine has become the 27th jurisdiction to adopt the Uniform Bar Examination, joining 25 states and the District of Columbia. This will make job hunting and practicing law so much easier for recent graduates
Change in First-Year Enrollment from 2010 to 2016 and Reported Changes to the LSAT Score at the 25th Percentile
File "/var/www/vhosts/thebarexaminer.ncbex.org/httpdocs/wp-content/uploads/Presidents-Page-2010-2016-First-Year-Enrollment-and-LSAT.xlsx" does not exist.
Sources: Data are from the American Bar Association Section of Legal Education and Admissions to the Bar, which obtains enrollment statistics from its annual questionnaire to law schools and makes the statistics available on its website. Data for total first-year enrollment: http://www.americanbar.org/groups/legal_education/resources/statistics.html (last visited February 24, 2017). Data for 25% LSAT score: http://www.americanbar.org/groups/legal_education/resources/aba_approved_law_schools/official-guide-to-aba-approved-law-schools.html (last visited February 24, 2017) and Standard 509 Information Reports, http://www.abarequireddisclosures.org/ (last visited February 24, 2017).
Change in Enrollment and LSAT Score at the 25th Percentile from 2010 to 2016
In the scatterplot below, each law school supplying complete data is represented by a dot (dots overlap when two or more schools reported identical values for both percent change in enrollment and change in LSAT score at the 25th percentile). The horizontal line in the scatterplot represents no change in LSAT score at the 25th percentile from 2010 to 2016, and the vertical line in the scatterplot represents no change in enrollment from 2010 to 2016. Unlike the 2010–2015 scatterplot that appeared in the March 2016 issue of this magazine, when there were no schools in the upper right quadrant, this year there is a single law school that has been able to increase both its enrollment and its LSAT score at the 25th percentile since 2010.
Changes in First-Year Enrollment and Average LSAT Score at the 25th Percentile, 2010–2016
Frequency of MBE Mean Scaled Scores across Jurisdictions in July 2016
This graph expresses the range in MBE mean scores for the 46 non-territory jurisdictions that scaled the written components of their bar examinations to the MBE in July 2016. The jurisdictions’ MBE mean scores ranged from 131 to 149. The most common MBE mean score was 142. There are many variables that contribute to the differences observed.
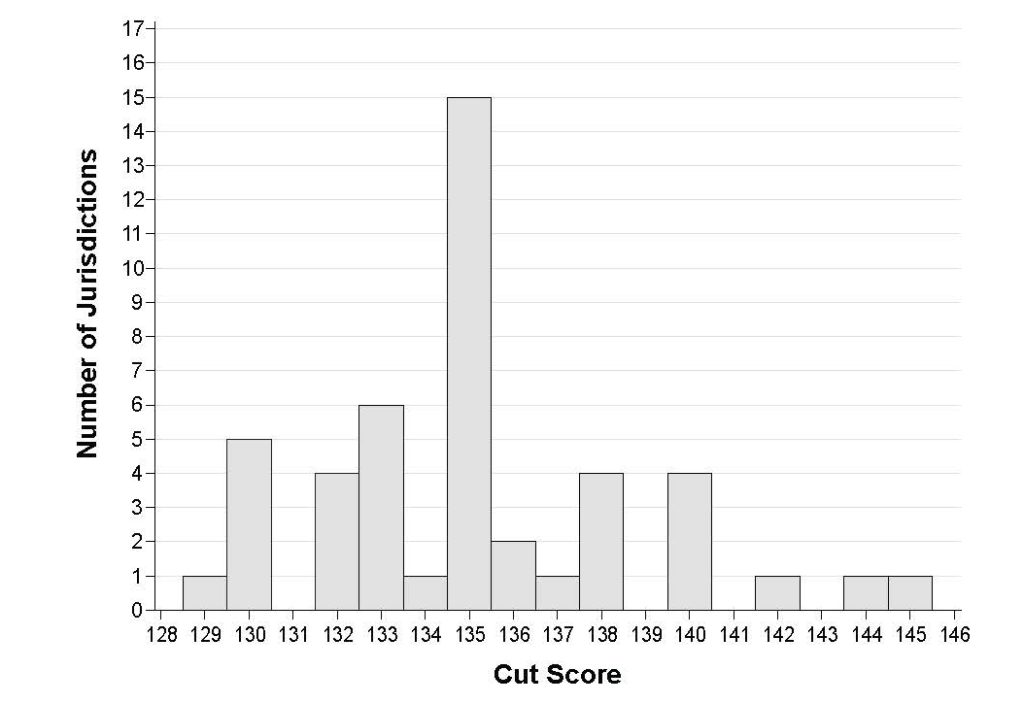
Frequency of Cut Scores across Jurisdictions in July 2016
This graph expresses the range of cut scores announced for July 2016 by the 46 non-territory jurisdictions that use the MBE and that scaled the written components of their bar examinations to the MBE (based on the jurisdiction’s MBE mean score) in July 2016. The most common cut score as expressed on the MBE scale is 135, and the range is from 129 to 145. (Scores on the Uniform Bar Examination are expressed as double the MBE score.)
Frequency of MBE Mean Scaled Scores in July 2013-2016
These smoothed distributions express the gentle glide leftward that captures the decline in MBE scores over time. The vertical line denotes the most common cut score chosen by jurisdictions to make pass/fail decisions (135). Using July 2013 as the baseline, the national MBE scaled score means for July 2014, July 2015, and July 2016 are plotted. It is evident that more examinees have had difficulty since the drop in law school enrollment that began with the class that entered in fall 2011 and graduated in 2014.
Contact us to request a pdf file of the original article as it appeared in the print edition.

