This article originally appeared in The Bar Examiner print edition, March 2016 (Vol. 85, No. 1), pp 4–13.
By Erica Moeser
 It is impossible for me to begin this column with anything other than a tribute to Beverly Tarpley, a former NCBE Chair who died on Valentine’s Day, a scant three weeks after she joined the Board of Trustees and 17 other former NCBE Chairs to celebrate this organization’s 85th year. Beverly, a Texas lawyer who practiced for over half a century in Abilene, was both intrepid and warm—and seemingly indestructible until cancer claimed her. Her career was marked with many “firsts,” and she was the second woman (after Professor Margo Melli) to chair NCBE.
Beverly was currently chairing our Editorial Advisory Committee, and her strong leadership contributed to the success of this publication. I know that Claire Guback, our editor, treasured their working relationship. For those of you who want a glimpse of a real pioneer, I recommend that you turn on your computers and search for “Abilene Reporter-News,” and then simply type in “Tarpley.” There is a piece written on February 15 that will take your breath away because it does more than record a remarkable life—it illuminates the sweep of history as women moved into the legal profession. And if you pause to read about the other Tarpley listed, you will learn of the accomplishments of Beverly’s late husband Dick, the paper’s editor for many years.
Yes, I am going to miss Beverly—her strength, her accessibility, her wisdom, her humor, and her engaging Texas-size smile—as are all of us who were fortunate enough to know her.
Winter still holds us in its grip here, and what else but good news about the Uniform Bar Examination could warm things on a cold day? I am delighted to announce that both South Carolina and the District of Columbia have acted early in 2016 to adopt the UBE. This brings the number of UBE jurisdictions to 21. South Carolina’s UBE will debut in February 2017, and D.C. will commence UBE administrations this July. There are serious stirrings in a number of other jurisdictions, and I anticipate that we will end 2016 with more than 21 participants. Welcome, South Carolina and D.C.!
The warming trend continued in February, as two major organizations adopted resolutions favorable to the UBE. On February 3, the Conference of Chief Justices adopted Resolution 10, which concludes, “NOW, THEREFORE, BE IT RESOLVED that the Conference of Chief Justices urges the bar admission authorities in each state and territory to consider implementation of the Uniform Bar Examination in their respective jurisdictions.” Then on February 8, the American Bar Association’s House of Delegates adopted Resolution 109, which simply states, “RESOLVED, that the American Bar Association urges the bar admission authorities in each state and territory to adopt expeditiously the Uniform Bar Examination.”
The ABA resolution resulted from yeoman efforts by the Law Student Division of the Association. Of course, law students grasp the significance of the mobility that the UBE offers new entrants into the legal profession. As I have written many times, in the current environment of loan burdens and challenging job hunts, the UBE offers a sensible alternative to redundant and expensive additional bar examinations imposed early in fledgling careers.
When this column appears in print, the February bar examination will be in the rearview mirror, and applicants and jurisdictions will be gearing up for July. As readers of this column know, I have been tracking factors that may be contributing to the drop in bar passage that has occurred in many jurisdictions. For that reason, I am including some information that is pertinent to that issue. The chart and graphics that follow draw on information that is publicly available from the American Bar Association.
The chart below is an update of a chart that ran in our June 2015 magazine. It includes data for the class that entered law school in fall 2015. The downward trends in first-year enrollment and scores marking the 25th percentile level of the Law School Admission Test (LSAT) are still discouraging. Those of us in bar admissions are watching for healthy upticks at the 25th percentile level of the LSAT. With enrollment numbers down, we see continuing budget stresses ahead for those jurisdictions that are funded solely by applicant fees. The latest class will emerge from law school in 2018. I am confident that many law schools are investing intense efforts to educate students, so perhaps these numbers will be belied by strong bar exam performances in the future.
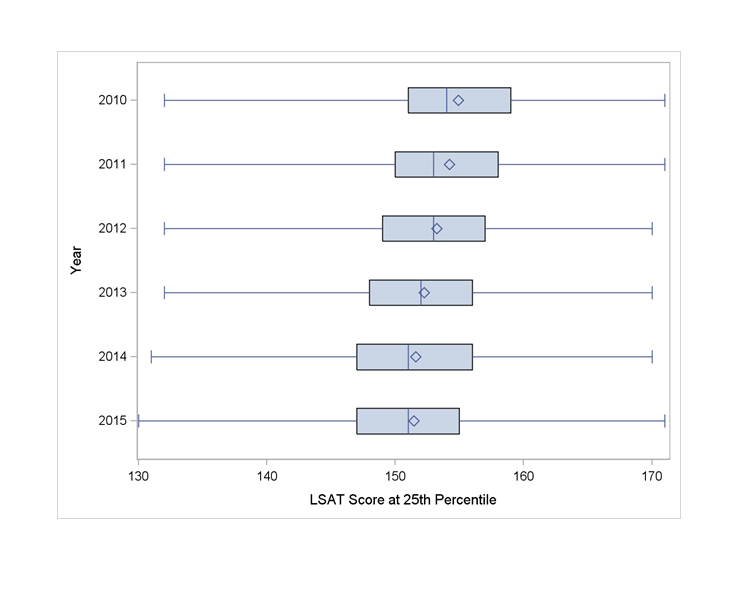
NCBE’s Dr. Andrew Mroch has given expression to the trend of reduced 25th percentile LSAT scores in the box-and-whisker plot that appears following that chart.
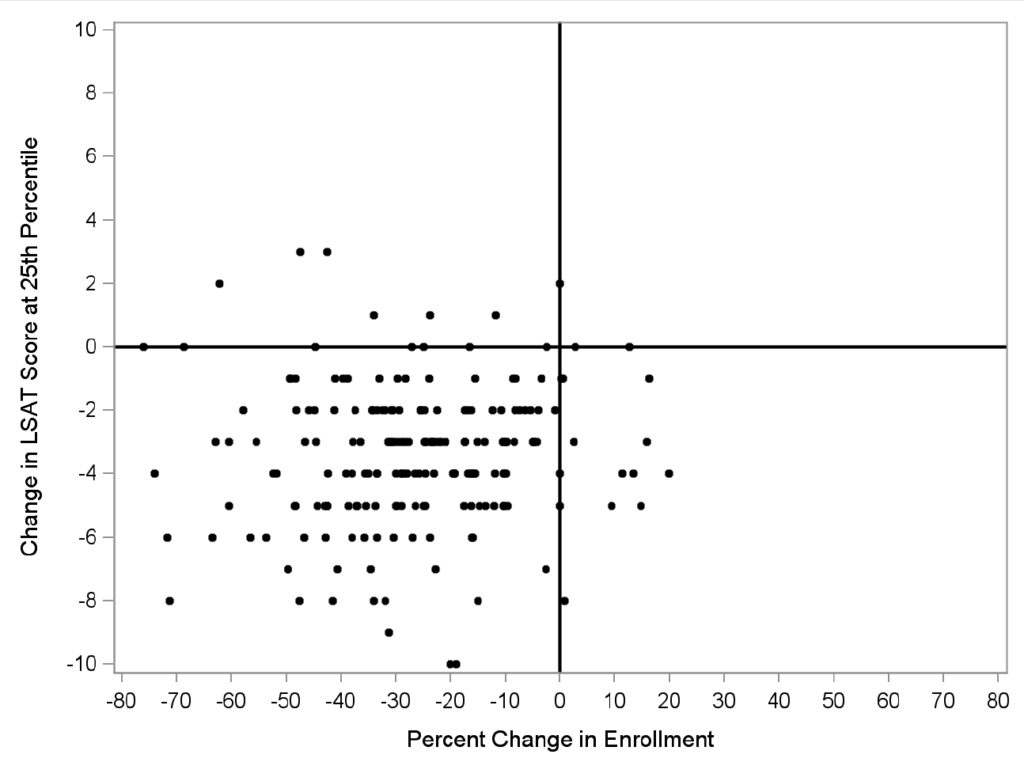
Dr. Mroch has also updated below a scatterplot rendering that was created by NCBE’s Dr. Joanne Kane last year. This update reveals changes from fall 2010 to fall 2015. It is a matter of concern that not a single law school has both increased its enrollment and raised the LSAT score that marks the top of the 25th percentile from what those figures were five years ago.
The graph following the scatterplot provides an alternate expression of the relationship between enrollment and LSAT scores at the 25th percentile.
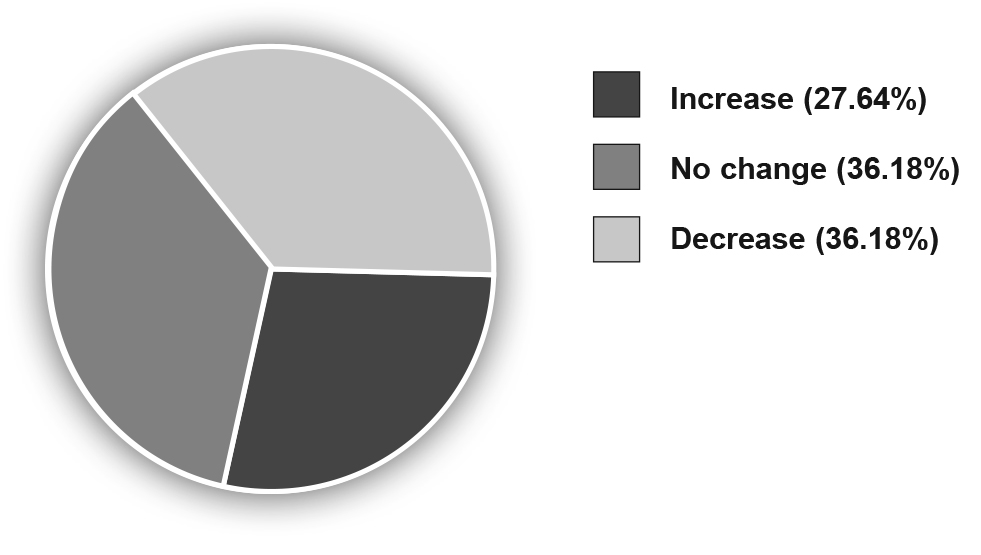
And finally, there is cause for some optimism. The pie chart at the end of this article depicts a comparison of changes to the LSAT score at the 25th percentile from fall 2014 to fall 2015. Over the last year, more than a quarter of ABA-approved law schools have managed to increase the LSAT score marking the 25th percentile for their incoming class. Six of these schools have increased their scores by three points. That is encouraging news at a time that has otherwise seemed bleak. I thank Andy Mroch and Joanne Kane for giving visual expression to the factors currently at play.
The legal profession has never been more important than in a world in which the Rule of Law is under attack. It has never been more important than at a time when the un-served and underserved are vulnerable. Those of us who are part of the licensing structure need to maintain fairness and consistency and high quality in what we do. Law schools must face and meet innumerable challenges as they prepare their graduates for licensure. In many ways, we are all in this together, and certainly all of us wish for better times.
Change in First-Year Enrollment from 2010 to 2015 and Reported Changes to the LSAT Score at the 25th Percentile
File "/var/www/vhosts/thebarexaminer.ncbex.org/httpdocs/wp-content/uploads/2010-2015-first-year-table-from-Pres-Page-0316.xlsx" does not exist.
Summary of 25th Percentile LSAT Scores for 2010–2015 Entering Classes
The box-and-whisker plots displayed summarize the distribution of 25th percentile LSAT scores for each law school’s entering class from 2010 to 2015. Each score that contributes to the plot for a particular year represents a single value for each school (the 25th percentile LSAT). Therefore, the box-and-whisker plots represent the distributions of schools’ 25th percentile LSAT scores from 2010 to 2015. The diamond within the box represents the mean of the 25th percentile LSAT scores across schools (which was 154.92 for the 2010 entering class and 151.46 for the 2015 entering class); the vertical line within the box represents the median of the 25th percentile LSAT scores across schools (which was 154 for the 2010 entering class and 151 for the 2015 entering class). The left side of the box represents the 25th percentile of the 25th percentile LSAT scores across schools, and the right side of the box represents the 75th percentile of the 25th percentile LSAT scores across schools. The minimum of the 25th percentile scores is represented by the left “whisker” at the edge of the horizontal line; the maximum of the 25th percentile scores is represented by the right “whisker” at the edge of the horizontal line.

Change in Enrollment and LSAT Score at the 25th Percentile from 2010 to 2015
In the scatterplot below, each school supplying complete data is represented by a dot (dots overlap when two or more schools reported identical values for both percent change in enrollment and change in LSAT score at the 25th percentile). The horizontal line in the scatterplot represents no change in LSAT score at the 25th percentile from 2010 to 2015, and the vertical line in the scatterplot represents no change in enrollment from 2010 to 2015. These two lines divide the scatterplot into four quadrants. Most of the schools appear in the lower left quadrant; this quadrant contains schools that have experienced decreases in both the LSAT score at the 25th percentile and their enrollment numbers. A few schools appear in the upper left or lower right quadrants. The upper left quadrant contains schools that have experienced an increase in their LSAT scores but a decrease in their enrollment numbers. The lower right quadrant contains schools that have experienced a decrease in their LSAT scores but an increase in their enrollment numbers. There are no schools in the upper right quadrant, which is the quadrant that would represent schools that had both increased their LSAT scores and increased their enrollment numbers.

Changes in First-Year Enrollment and Average LSAT Score at the 25th Percentile, 2010–2015

A Comparison of LSAT 25th Percentiles between 2014 and 2015

The following law schools are excluded: Rutgers University (representing the 2015 consolidation of Rutgers University–Camden and Rutgers University–Newark) and Penn State University (divided in 2015 into Penn State–Dickinson Law and Penn State–Penn State Law).
Contact us to request a pdf file of the original article as it appeared in the print edition.


