This article originally appeared in The Bar Examiner print edition, Fall 2022 (Vol. 91, No. 3), pp. 12–15.By Danette Waller McKinley, PhD
A series of articles on topics of immediate significance to the bar admissions community.
DIVERSITY SERIES: Diversity in the legal profession and efforts to enhance the participation and success of underrepresented and/or historically disadvantaged groups in legal education and bar admissions.
The purpose of the bar examination is to help ensure that newly licensed lawyers possess the minimum knowledge and skills to perform activities typically required of an entry-level lawyer. In developing the components of the bar exam, NCBE actively works to eliminate any aspect that could contribute to performance disparities among different groups. We do this to ensure that all examinees have a fair opportunity to demonstrate their knowledge and skills.
There have been assertions, however, that the bar examination is exclusionary if the percentage of lawyers of different races/ethnicities in a jurisdiction does not reflect the percentage of that group in the wider population. As an example, let’s examine an assertion: although 12% of the US population is Black, less than 12% of US attorneys are Black, so the bar examination is a barrier to Blacks.
In this article, I offer various types of data to consider when evaluating this assertion: data pertaining to diversity in the college and law school enrollment pipelines, diversity in other professions, and diversity in the legal workforce. Ultimately, I argue that the data reflects the state of the pipeline, from high school to college to law school, to licensure, and then on to one’s legal career. This pipeline narrows as it runs; identifying the areas with the greatest narrowing provides useful context as the legal community seeks to improve its diversity.
College Enrollment
When considering the composition of the legal profession by race/ethnicity, we should first look at college enrollment, as most US law schools require a college degree for admission.
Figure 1 shows college enrollment by race/ethnicity for the entering classes of 2015 through 2019. This figure shows that those enrolled in college were predominantly White. In fact, for the years shown, only about 10% of those enrolled in four-year colleges were Black.
Figure 1. College enrollment by race/ethnicity, entering classes 2015–2019
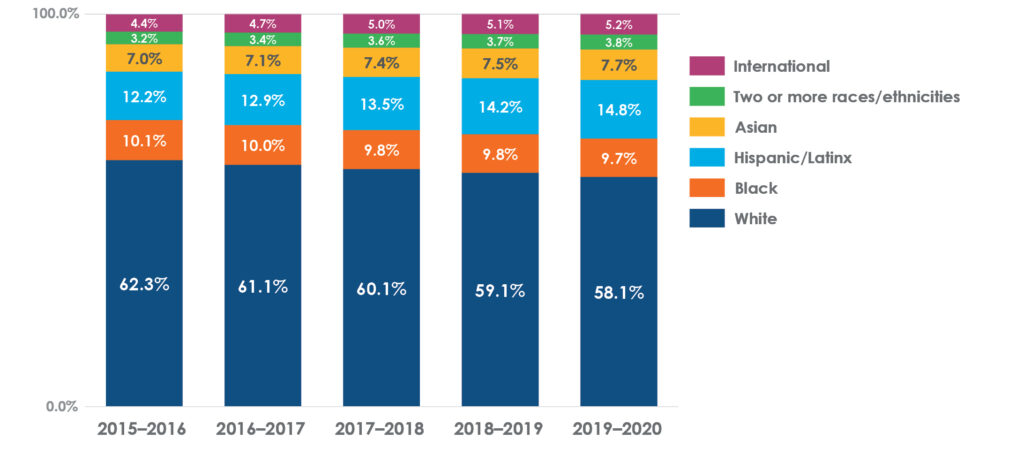
Source: National Center for Education Statistics.Note: International students are represented separately in the figure because non–US citizens do not conform well to US Census categories.
Law School Enrollment and Graduation
Figure 2 shows ABA-accredited law school enrollment and JDs awarded by race/ethnicity in 2021. The potential population seeking bar admission is based on the pool graduating from law schools. Blacks represented less than 8% of those enrolled and who graduated in 2021; between the total US population and law school, the overall decrease in representation of Blacks in the pipeline is approximately four percentage points. During law school itself, however, the attrition of Blacks is less than one percentage point, from approximately 7.7% representation at matriculation to approximately 7.4% at graduation.
Figure 2. ABA-accredited law school enrollment and JDs awarded by race/ethnicity, 2021

Source: American Bar Association.
Attorney Admissions
Over the past few years, the ABA began collecting bar exam pass/fail data from law schools, seeking to determine the effect of Standard 316’s bar passage requirements on school accreditation.1 Looking at the 2019 class—the last cohort that graduated pre-pandemic—reveals less than a one-point decrease in the percentage of Blacks in the pipeline: 7.9% of examinees who took the bar from that class were Black, and 7.1% of examinees who passed the bar exam within the ABA’s two-year window were Black. This decrease in Black representation due to bar passage is strikingly similar to and also overlaps with the numbers seen during law school, and both law school and the bar exam see less attrition of Black candidates than between high school and college, between college and law school, or between bar passage and representation of Blacks in the legal profession overall.
Diversity in Other Professions
Diversity in the legal profession does not exist in a vacuum, as college-educated individuals have a wide range of options for employment post-graduation. Figure 3 shows the racial/ethnic distribution for several professions. The data show that Black workers are underrepresented in professional occupations. For example, whereas 13% of the workforce is Black, only 10% of the professional workforce is Black. While the law appears to be the least diverse of the professions, it is important to note that there are differences between the percentage of all professionals and those in the population, in general.
These data also provide some information for career selection by race/ethnicity. Among the professions tracked by the Economic Policy Institute, social service work is the one that Black professionals are most likely to enter. Career choices are likely to be influenced by several factors, including economic challenges in pursuing higher education.
Figure 3. Racial/ethnic diversity in select professions
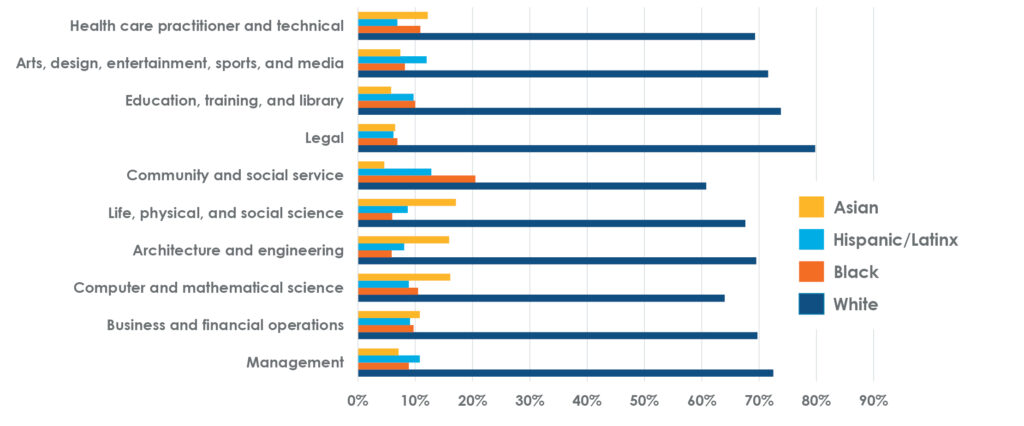
Source: Economic Policy Institute, Current Population Survey Extracts, Version 1.0.15 (2021), https://www.epi.org/publication/racial-representation-prof-occ/.
The Legal Workforce
In 2020, the ABA estimated Black representation among licensed attorneys as only 5%, a decrease of approximately two points from the percentage seen passing the bar exam today.2 Undoubtedly some of that two-point difference is due to historical trends and the relatively recent increase in Black attorneys over the past 40–50 years. Attrition in the workforce also plays a part—for example, in 2020 the ABA Commission on Racial and Ethnic Diversity in the Profession found that attrition for all minority attorneys working at law firms was two to three times the attrition for White attorneys.3
When the data are limited to attorneys, the distribution by type of practice can be examined. Figure 4 shows practice patterns by race/ethnicity and is based on data collected by the American Bar Foundation and the National Association of Law Placement. Black attorneys are more likely to be in government positions or in solo practice. These patterns indicate that even after completing legal education and passing the bar, employment opportunities vary when race and ethnicity are considered.
Figure 4. Legal employment type by race/ethnicity

Source: After the JD III: Third Results from a National Study of Legal Careers, American Bar Foundation and National Association of Law Placement.
Conclusion
The data presented in this article provide context for the assertion about race and the bar examination. Ultimately, the percentage of Black college students alone indicates that the pre-practice pipeline does not allow the percentage of Black US attorneys to match the percentage of Blacks in the overall US population. And the employment opportunities available vary at the other end of the pipeline when race and ethnicity are considered.
When thinking about racial/ethnic diversity in the legal profession, there are many factors at play. I hope the data in this article provide context for critically thinking about this important topic.
Notes
- See ABA Section of Legal Education and Admissions to the Bar, “Summary Bar Pass Data: Race, Ethnicity, and Gender, 2021 and 2022 Bar Passage Questionnaire,” available at https://www.americanbar.org/content/dam/aba/administrative/legal_education_and_admissions_to_the_bar/statistics/2022/2022-bpq-national-summary-data-race-ethnicity-gender-fin.pdf. (Go back)
- ABA National Lawyer Population Survey, Lawyer Population by State, Year 2022, available at https://www.americanbar.org/content/dam/aba/administrative/market_research/2022-national-lawyer-population-survey.pdf. (Go back)
- ABA Commission on Racial and Ethnic Diversity in the Profession, “2020 ABA Model Diversity Survey,” available at https://www.americanbar.org/content/dam/aba/administrative/racial_ethnic_diversity/aba/credp_2020_mds_report.pdf. (Go back)
 Danette Waller McKinley, PhD, is the Director of Diversity, Fairness, and Inclusion Research for the National Conference of Bar Examiners.
Contact us to request a pdf file of the original article as it appeared in the print edition.