This article originally appeared in The Bar Examiner print edition, June 2015 (Vol. 84, No. 2), pp 35–48.
By Mark A. Albanese, PhDIn July 2014, the mean score on the Multistate Bar Examination (MBE) was 141.5, a decline of 2.8 points from July 2013. The 2.8-point decline was the largest year-to-year drop in the past 34 years. Figure 1 shows the mean July MBE scores from 1980 through 2014. The July 2014 mean MBE score is the lowest since 2004 (141.2), although such a value would not have been uncommon between 1980 and 1991 or between 1998 and 2005.
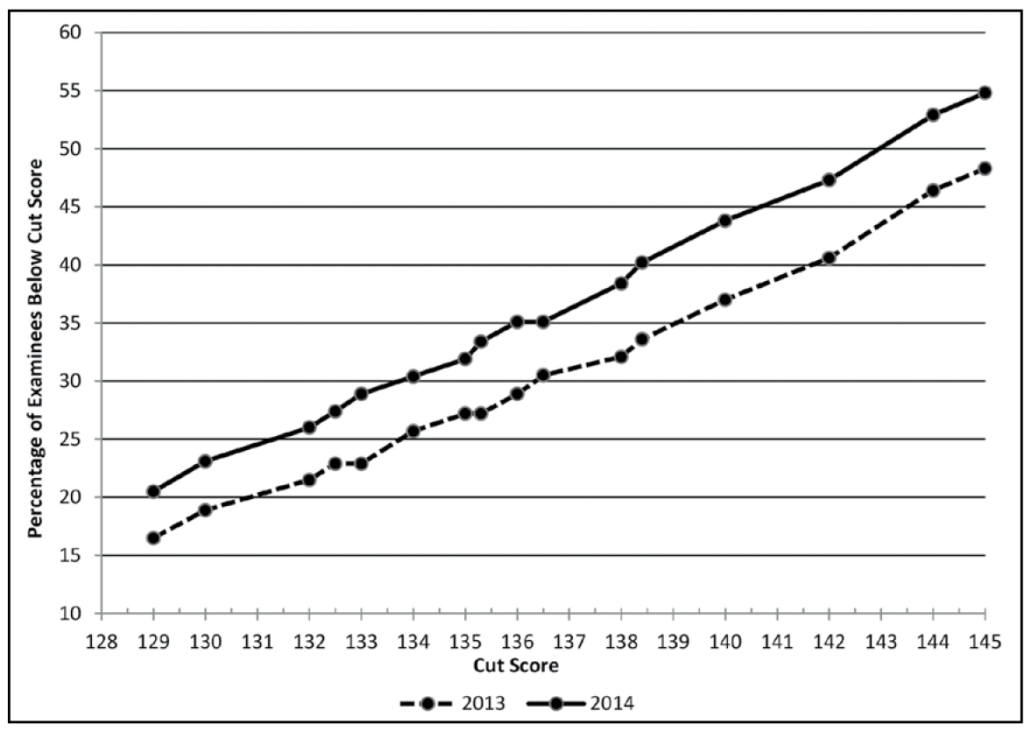
The estimated impact of the decline in MBE scores on bar failure rates as a function of the cut score used in various jurisdictions (which ranged from 129 to 145 in July 2014) is shown in Figure 2. (These are projections using MBE scores only; the actual failure rate will generally be based upon a combination of the MBE and the written component of the bar exam. In most cases, the actual failure rate will be lower than that estimated by the MBE alone.) Depending on the cut score, jurisdictions were expected to see an increase in bar failures from July 2013 to July 2014 ranging between 2.9% and 8.7%. Jurisdictions with a cut score of 135—by far the most common, with 15 jurisdictions using it—were expected to see a 4.7% increase in bar failure in July 2014 compared to July 2013. Small jurisdictions were some of the hardest hit, with one having an estimated increase in bar failure of 30%. Overall, the failure rate in July 2014 was estimated to increase 4.5%, but not uniformly across all jurisdictions.
In response to this decline in MBE scores, NCBE reviewed all of its procedures to see if there was some aspect of test production or scoring that could have produced this result. The approach to item writing and exam creation was the same as for previous exams. The test score reliability of the July 2014 MBE was 0.92, a new high. The methods we use to score the examination, the core of which is called Three-Parameter Item Response Theory, are state-of-the-art. We have built-in quality control methods that make errors extremely unlikely to occur. We continually strive to adhere to the highest standards of testing practices. To be doubly certain of our results, we contracted with an independent psychometric group, the Center for Advanced Studies in Measurement and Assessment (CASMA), to re-equate the July 2014 examination. CASMA is one of the premier psychometric groups in the world. Their results confirmed ours to three decimal places. They even tried different equating methods and software to see if there was anything idiosyncratic to our procedures that could have caused the decline, again finding no difference from what we reported. In short, we have been unable to find anything that we did at NCBE that could have caused the decline in MBE scores that occurred in July 2014.
NCBE conducted several analyses to gain a better understanding of and to seek possible explanations for the decline. These analyses focused on two areas: (1) the extent to which the July 2014 scores show consistency with concurrent (2014) indicators, and (2) whether precursor data such as fall 2011 law school applicant and enrollment data (i.e., for those who graduated and took the bar exam in 2014), including LSAT scores, could have predicted the decline in MBE scores.
Figure 1: Mean July MBE scores, 1980-2014
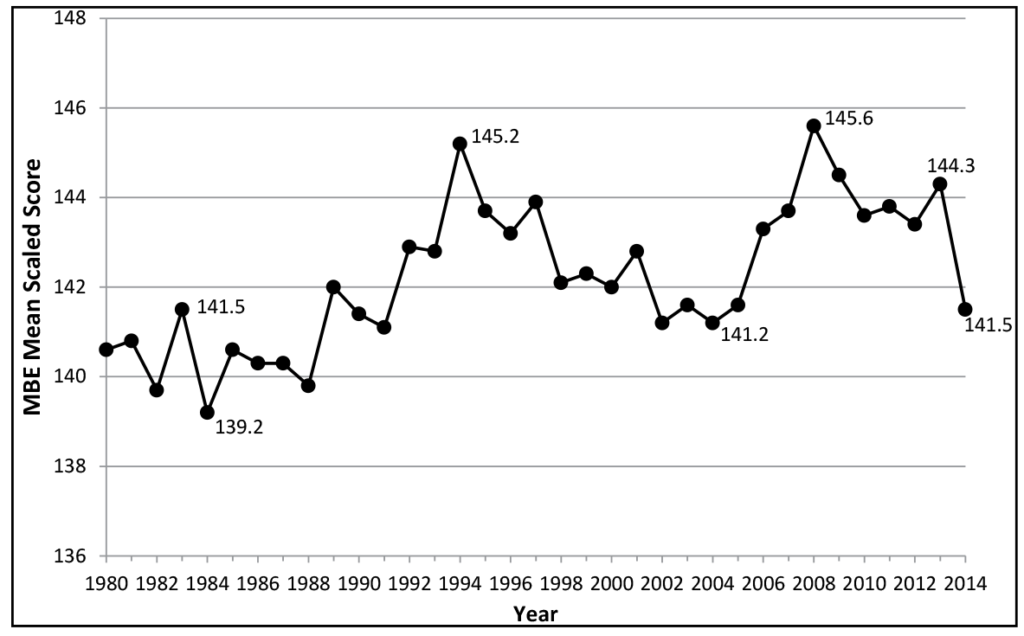
Figure 2: Percentage of examinees below MBE cut scores in July 2014 versus July 2013
Consistency of July 2014 MBE Scores with Concurrent Indicators
For this part of the analysis, we focused on three indicators. We first examined whether repeat takers of the July examination had differences from their previous performance that were comparable to those of first-time takers in 2014 versus 2013. We then looked at how July 2014 examinees performed on MBE items that had been reused from earlier examinations. Finally, we examined the performance of the 2014 graduates on a different multiple-choice examination, the Multistate Professional Responsibility Examination (MPRE), to see whether results from 2014 versus 2013 were comparable to those found for the MBE.
Performance of Examinees Who Repeated the MBE
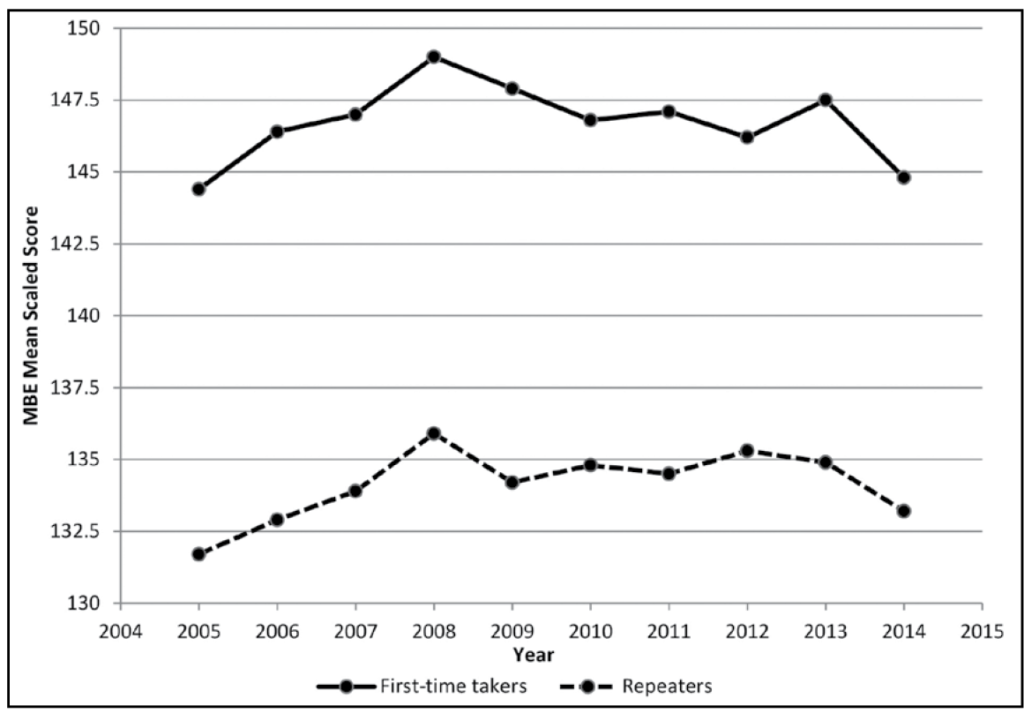
Figure 3 shows the mean scores on the July MBE by examinees who were known first-time takers and repeaters from 2005 through 2014. Compared with July 2013, the July 2014 mean scores of repeaters declined by 1.7 points compared to 2.7 points for first-time takers.
In the nine year-to-year changes since 2005, repeat examinees experienced two changes that were equal to or larger than the one from 2013 to 2014 (an increase of 2.0 points from 2007 to 2008 and a decline of 1.7 points from 2008 to 2009). The 2.7-point decline for first-time takers in July 2014, however, is beyond any change in at least the past decade and, judging from overall trends shown in Figure 1, maybe since 1980. Thus, the comparison of the relative performance of examinees who were repeating the MBE with those taking it for the first time points to the July 2014 first-time takers as performing disproportionately less well than those in the past.
Figure 3: July MBE means for first-time takers and repeaters, 2005-2014
Performance on Previously Used Items
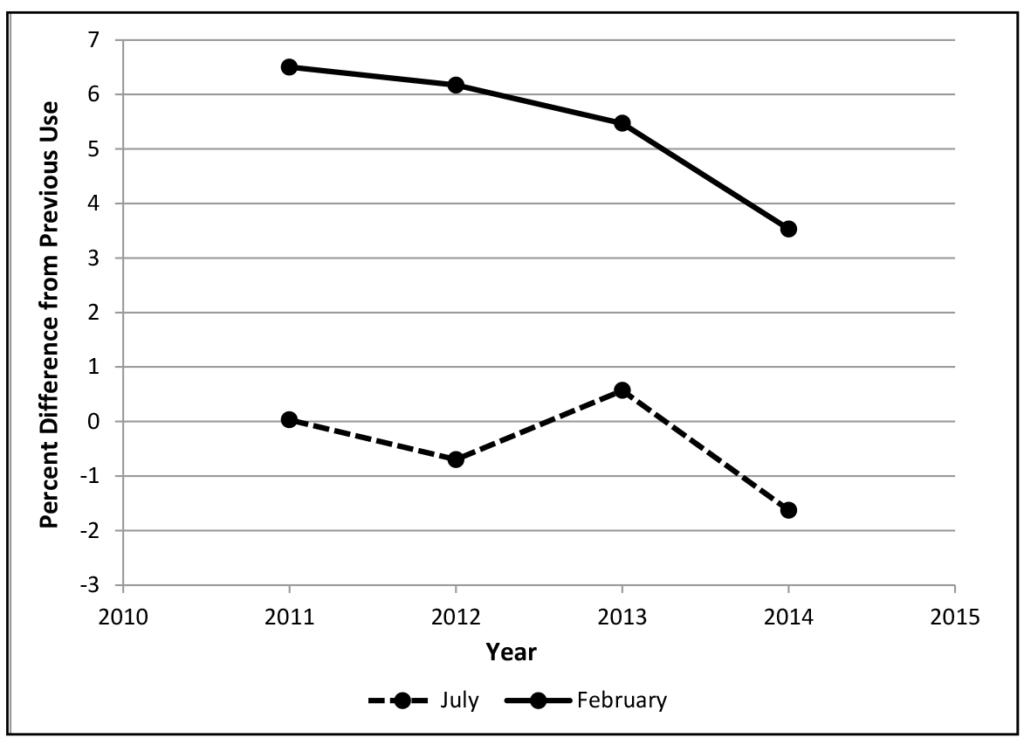
Figure 4 shows differences in the mean percentage correct for items on the July 2014 MBE that had been previously used in a July examination and a separate set of items previously used in a February examination. For comparison purposes, similar mean percentages are provided for MBEs administered from 2011 to 2013.
In July 2014, the percent correct on items previously used in a July examination declined by 1.63%. This compares to an increase of 0.57% in 2013, resulting in a year-to-year decrease of 2.20%. This decrease was larger than any year-to-year change since before 2011. Further, the decline of 1.63% was the poorest performance of examinees on July repeat items since before 2011.
For items previously used in a February examination, it is expected that July performance will be higher due to the high proportion of repeat takers in February (approximately 60% of February examinees compared to less than 20% in July). Before July 2014, the smallest increase in performance shown by July examinees on items previously used in February was over 5%. The July 2014 examinees had only a 3.53% higher performance on the reused items than was had by the February examinees. This value was a decline of 1.94% in mean percent correct from 2013 levels. This decline was also the largest since at least 2011 and, as noted above, the level reached was the lowest since at least 2011.
In summary, performance of the July 2014 examinees on items that had been used previously was poorer than for any group of examinees for at least the last three years.
Figure 4: Differences in percent correct on items reused from previous February and July Examinations, 2011-2014
MPRE Performance
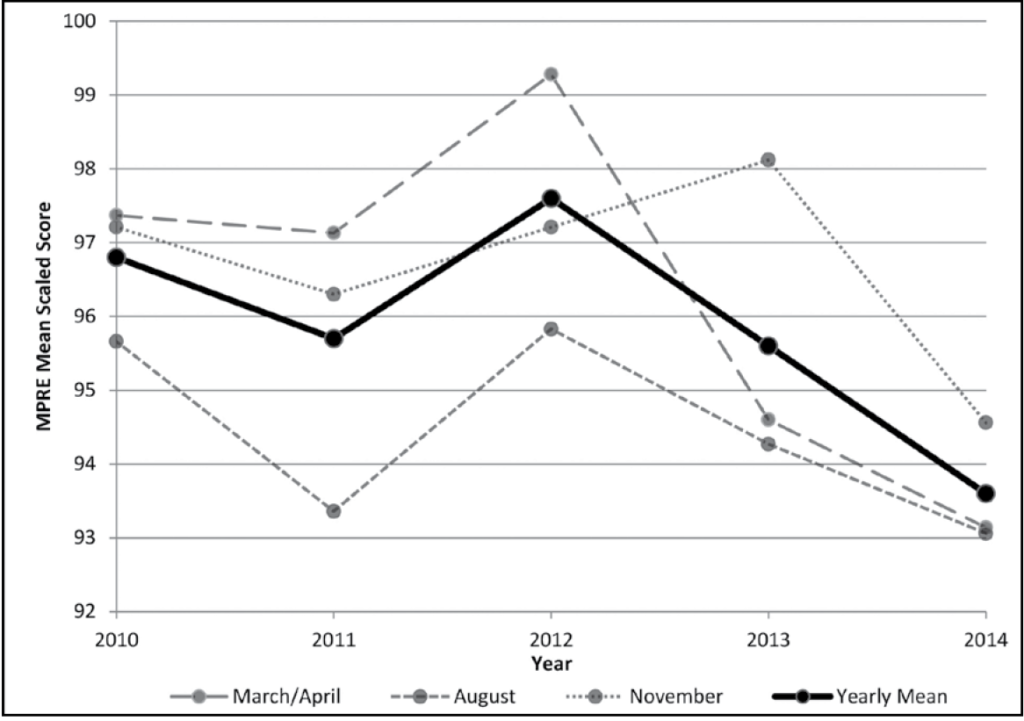
Examinees begin taking the MPRE during their last year of law school. The MPRE is administered three times per year, in March/April, August, and November. Figure 5 shows the mean scaled MPRE scores for each of the three administrations and the combined yearly mean from 2010 through 2014. The August means are nearly always lower than the March/April and November means, but the August 2014 mean was 1.2 scale points below that from 2013 and the lowest it has been in over five years. Similarly, the March 2014 mean was 1.5 scale points below the April 2013 mean and 6.1 points below the March 2012 mean and again the lowest it has been in over five years. The November 2014 mean was 3.6 points below the November 2013 mean and again the lowest over the five-year period. Combining across all three administrations, the mean in 2014 was 93.6, compared to 95.6 in 2013, a drop of 2 points. Overall, the mean in 2014 was from 2 to 4 points below any mean in the period extending back to 2010. Given that the standard deviation of the MPRE is about the same as that for the MBE, the decline in scores for the MPRE in 2014 compared to 2013 was slightly less than that of the MBE, but of a similar order of magnitude. Thus, the pattern of lower performance seen with the July 2014 MBE was also seen with all three 2014 administrations of the MPRE.
So, we have seen a very consistent pattern of decreased performance in all three of the measures examined that were concurrent with the July 2014 MBE.
Figure 5: MPRE mean scaled scores by administration, 2010-2014
Precursor Data
The next part of our analysis involved exploring whether there was anything that would have led us to expect such a decline in MBE scores. For this purpose, we examined the law school applicant and enrollment data for the 2014 graduates, who would have entered law school in the fall of 2011, as well as the LSAT scores of this group of graduates.
Law School Applicants and Enrollment
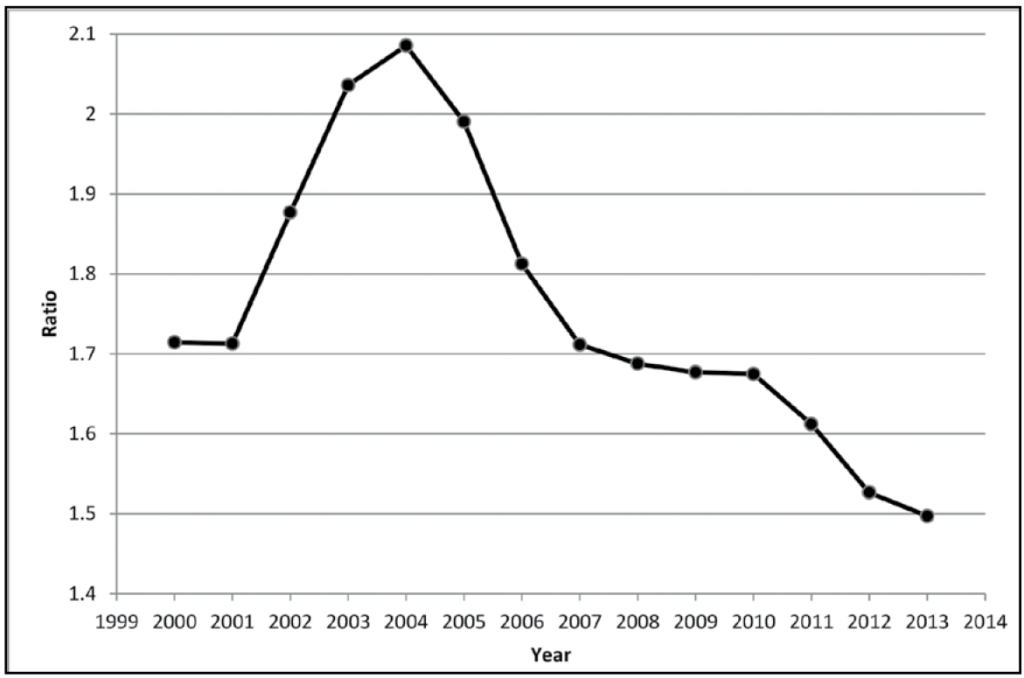
Figure 6 shows the number of law school applicants and the number of law school students enrolled as of October each year from 2000 to 2013. Figure 7 shows the ratio of the number of applicants to enrollees over the same period. Figure 7 could be considered an index of competitiveness to get into law school, as it reflects the number of applicants competing for each seat in law school.
In 2010 there were 87,900 applicants vying for 52,488 seats in law school; in 2011, there were 78,500 applicants competing for 48,697 seats in law school, a 10.7% reduction in applicants and a 7.2% reduction in enrollment. This is the lowest number of applicants since 2001, when there were 77,200 applicants applying for 45,070 seats in 184 law schools (there were 201 law schools in 2011). There were 1.71 applicants per seat in law school in 2001 compared to 1.61 for each seat in 2011. Before 2011 the ratio was never less than 1.65 applicants per seat since at least 2001.
To reinforce this assessment, the number of Credential Assembly Service (CAS) registrations, a requirement for applying to law school, declined by 20.4% from fall 2010 to fall 2011. This is the lowest number of CAS registrations since before fall 2005. So, the 2011 enrollees who were the examinees graduating in the spring of 2014 and taking the July 2014 MBE for the first time were admitted under the least competitive conditions in at least the last decade.
Comparing the trends in applicants and enrollment shown in Figure 6, applicants peaked in 2004 at 100,600 and, except for a slight rise in 2009 and 2010, have been declining since. The decline in 2011 ended a brief plateau that accelerated to a double-digit year-to-year decline that continues. Enrollment numbers had a different trajectory. They had risen at a steady rate of about 800 per year between 2000 and 2010, increasing in total by approximately 9,000 over that 11-year period. Comparing the two trend lines, enrollment was on a steady rise even as the applicant pool started to decline after 2004. Between 2004 and 2010, the applicant pool declined by 12.6% while law school enrollment increased by 8.8%. The rise in enrollment came to an abrupt halt in 2011 with a 7.2% decline that coincided with the first double-digit decline in applicants (10.7%). Since a decline in applicants was not an uncommon occurrence over the past decade of sustained enrollment growth, there must have been something about the 2011 applicant pool that changed the growth mind-set of admissions committees and sent enrollment on a downward trajectory unlike any previously seen this century.
Figure 6: Law school applicants and enrollees, 2000-2013
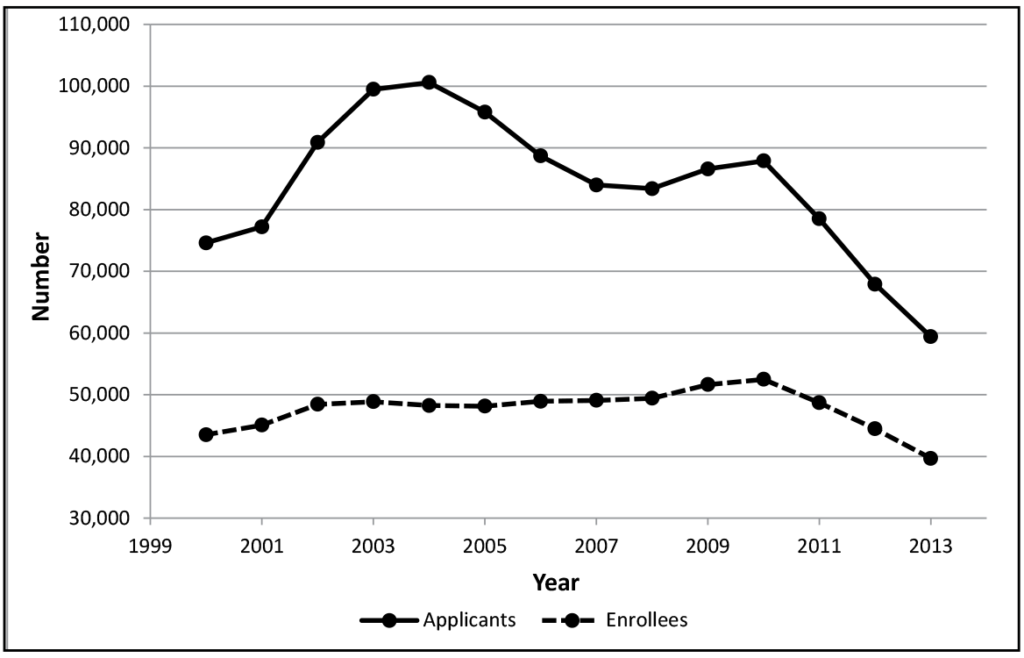
Figure 7: Ratio of law school applicants to enrollees, 2000-2013
LSAT Scores
The declines in applicant-to-enrollee ratio and CAS registrations would not lead to a decline in the performance of examinees on the bar examination if the examinees were just as academically accomplished as those who came before them. To determine if there is any evidence that the examinees entering law school in 2011 were not as accomplished as those who came before them, we examined trends in Law School Admission Test (LSAT) scores. (The LSAT is an equated test, like the MBE. It is almost universally used to guide admissions decisions at law schools in the United States.) LSAT scores can also be used to see how applicants compare with those who are admitted to law school. For these comparisons we turn to data reported by the Law School Admission Council (LSAC). (I have been using the term enrollees to refer to first-year students in law school because the data on first-year law students to this point has mostly come from the ABA, which collects its enrollee data in October of the academic year. LSAC uses the term matriculants to refer to first-year law students who are still enrolled at the end of the academic year. The number of matriculants will differ from the number of enrollees by the amount of attrition that occurs between October and the end of the academic year.)
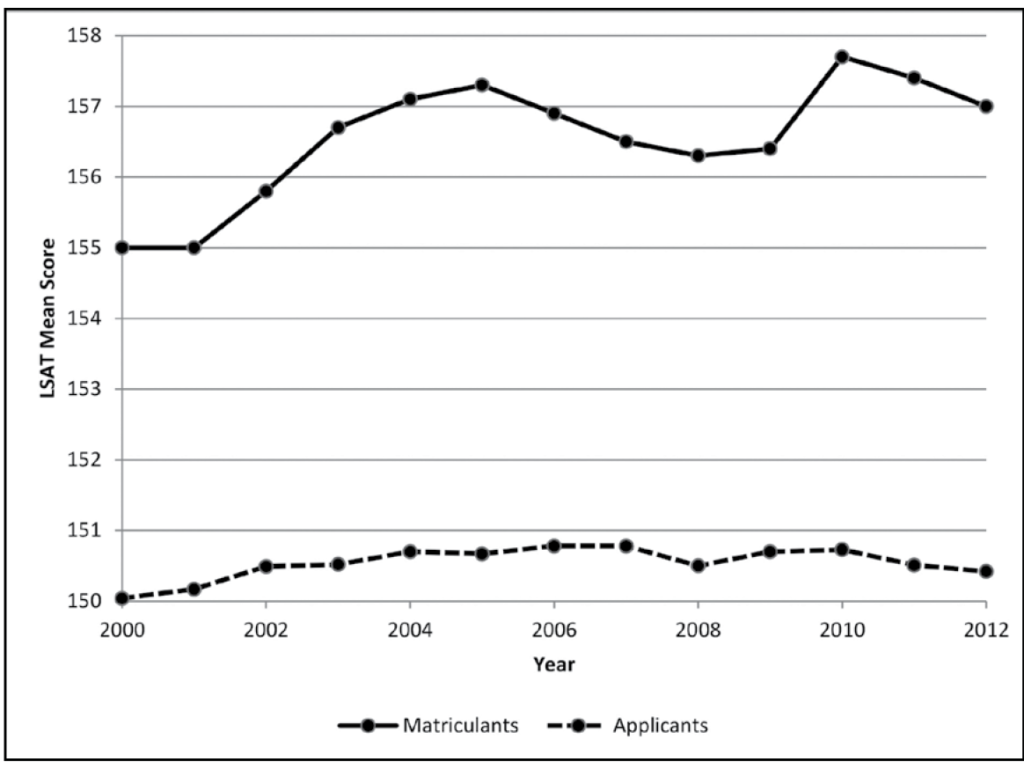
LSAT Scores for Applicants vs. Matriculants
Figure 8 shows the plot of the mean LSAT scores for applicants and matriculants from 2000 to 2012. The mean for the applicants is typically from 5 to 7 points below that of those admitted to law school. Over the 13-year range, the means for the applicants have varied by only 0.74 point compared to 2.7 points for the matriculants. For the 2011 group that took the July 2014 MBE, the drops in mean scores for the applicants (0.22) and the matriculants (0.3) were similar to each other. The correlation between the LSAT means for applicants and matriculants since 2002 was only 0.25 (where a value of 1 would indicate a perfect correlation and a value of 0 would indicate no correlation at all), indicating that the ups and downs in the mean LSAT scores of matriculants were only marginally related to those of the applicant pool.
Figure 8: LSAT mean scores for applicants and matriculants, 2000-2012
LSAT First-Quartile Scores at the Law School Level
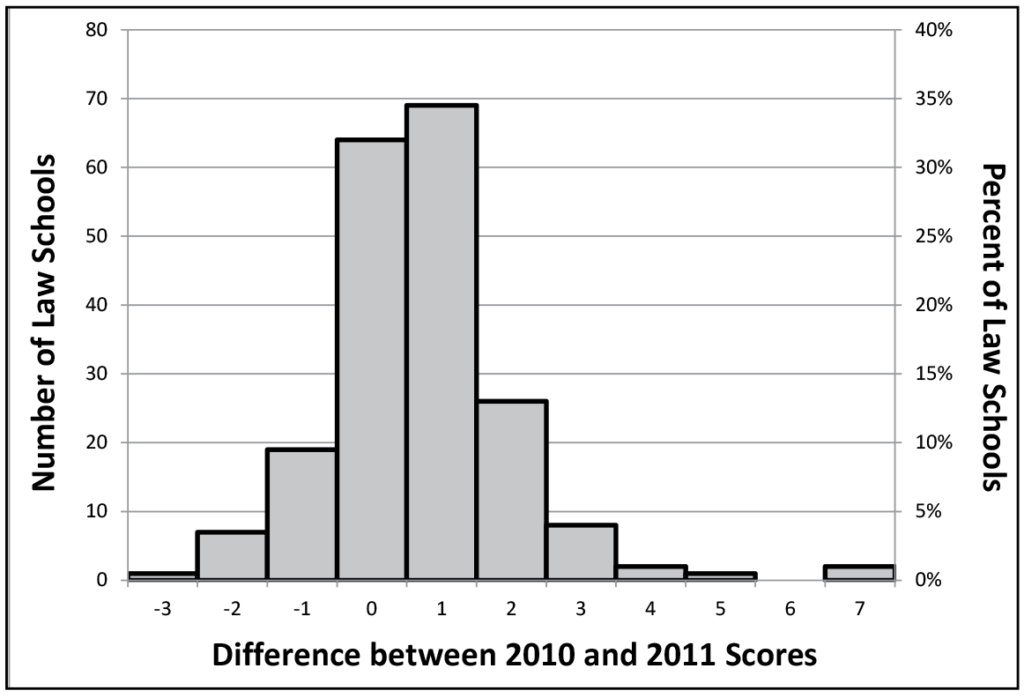
LSAT first-quartile scores were also examined at the law school level. The first quartile is the score that separates the bottom 25% from the remaining 75%. Figure 9 shows the frequency distribution of the differences in first-quartile scores between 2010 and 2011 for the 199 ABA-accredited law schools that reported data in both years. In 2011, 108 (54.3%) schools reported lower first-quartile scores by 1 or more points. Only 27 (13.6%) schools reported higher first-quartile scores. So, even after the 7.2% reduction in class sizes that occurred in 2011, the first-quartile LSAT scores declined in over half of the law schools.
Figure 9: Distribution of the difference between 2010 and 2011 LSAT law school first quartile scores for 199 law schools
LSAT Performance and MBE Scores
Next, performance on the LSAT in 2011 was linked with that on the MBE in July 2014. Figure 10 shows the plot of matriculant mean LSAT scores against the mean MBE scores for law school entry years 2000–2011. The correlation between mean July MBE scores and mean matriculant LSAT scores for those years was 0.66 (p<0.0192). The value represented by the triangle is for the July 2014 MBE. Note that the July 2014 value is not showing the same trend as the other points—that is, it shows a mean MBE score that is much lower than that of other points with similar mean LSAT scores. In fact, if the July 2014 point is removed, the correlation between mean July MBE scores and mean matriculant LSAT scores increases from 0.66 to 0.89 (p<.0002). If LSAT scores had been used to predict the MBE mean in July 2014, the estimated MBE mean would have been approximately 144.0, not the 141.5 value that was obtained. There clearly appears to be a disruption in the relationship between the matriculant LSAT scores and MBE scores with the July 2014 examination.
Figure 10: Mean July MBE scores versus mean matriculant LSAT scores for law school entry years 2000-2011
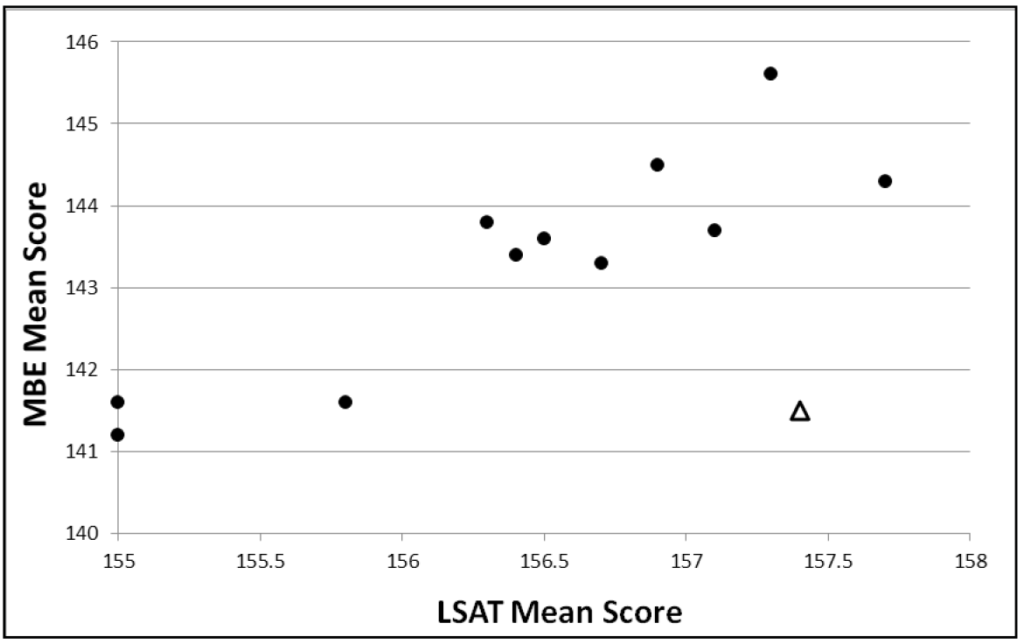
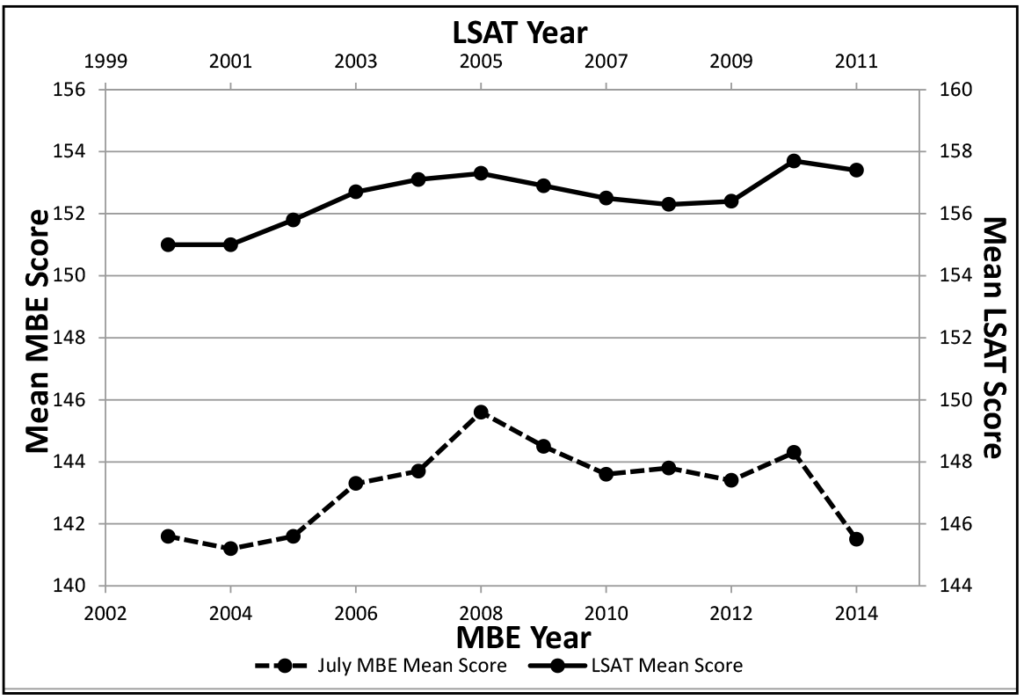
Figure 11 shows a plot of matriculant mean LSAT scores and mean July MBE scores for those matriculants by year since 2000. Generally, it can be seen that a change in the matriculant LSAT scores is accompanied by a somewhat exaggerated change in the July MBE scores, but the decline in July 2014 was more than has been seen in the past. It appears that something happened in 2011 that disrupted the previous relationship between MBE scores and LSAT scores.
Figure 11: Mean LSAT and July MBE scores as a function of LSAT year, 2000- 2011
The Change in LSAT Reporting Criteria
In June 2006, the ABA revised its criteria for reporting LSAT scores for admitted students who took the LSAT multiple times. Previously, schools were required to compute the mean of all LSAT scores taken within five years in determining individual matriculants’ LSAT scores. After that time (the new criteria went into effect in fall 2007), schools were required to report the highest score. The ABA requires that each accredited law school report LSAT quartile scores (25th, median = 50th, 75th) for its entering class in an annual survey. The ABA publishes the LSAT quartiles on its website, where prospective students can evaluate different law schools in deciding where to apply. Even more influential are the U.S. News and World Report rankings of law schools that use the LSAT median from the ABA data as one of 12 criteria in determining their rankings.
A final relevant issue related to multiple LSAT takers and the decline in MBE scores in July 2014 is that in the fall of 2010, midway in the test cycle for the 2011 matriculants (June begins the test cycle), the Law School Admission Council (LSAC, administrator of the LSAT) began to base its annual National Decision Profiles upon the highest LSAT scores of applicants and matriculants. So, the LSAT score used to predict MBE scores for multiple LSAT takers before the 2011 entry class was based upon the mean of LSAT scores, whereas in 2011, the LSAT score used to predict MBE scores for multiple LSAT takers was based upon the highest LSAT score.
In a sample of over 184 law schools for entering classes between 2005 and 2008, Sweeney et al (2010) demonstrated that using the highest LSAT score of repeat takers inflated mean LSAT scores by 2.3 points over using the mean score of repeat takers. Using the highest value also over-predicted law school GPA, meaning that using the highest of repeat LSAT scores predicted that students would get a higher GPA than they actually did. This finding replicated results from three previous studies covering four-year periods stretching back to 1993–1996.
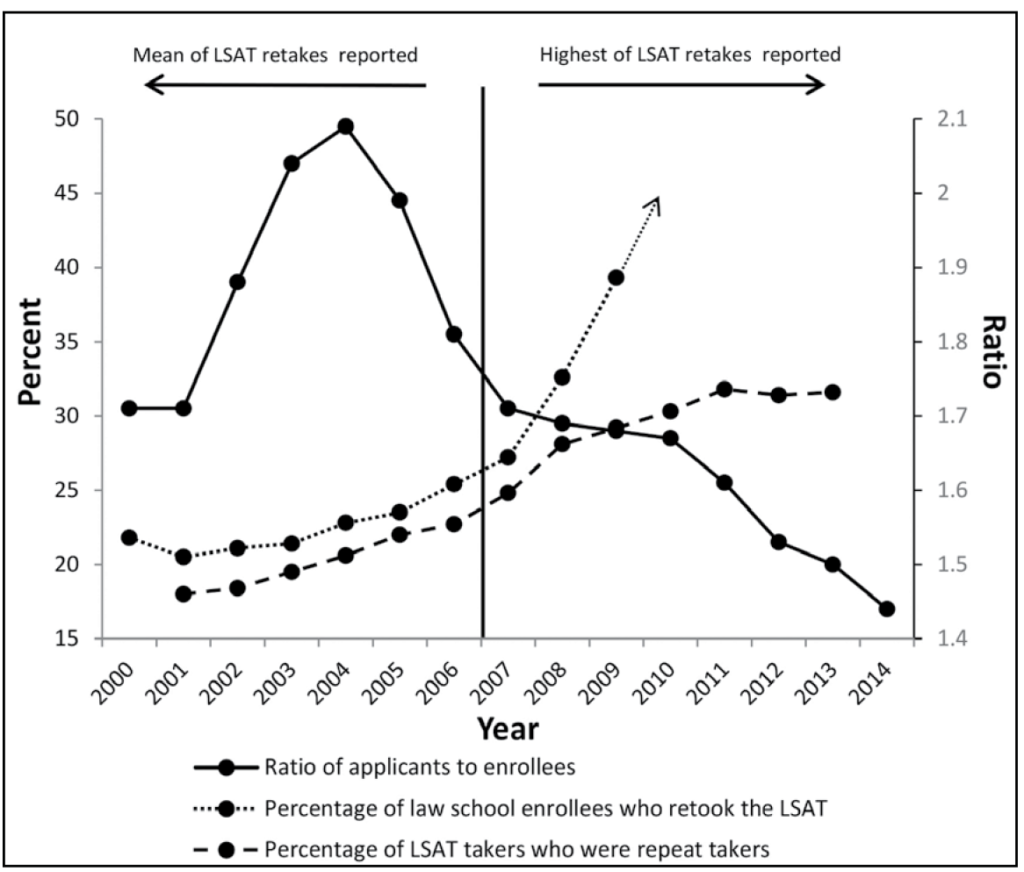
Given that the switch to reporting the highest LSAT score occurred with the entering class of 2007, the question is whether this change had an impact on admission practices of law schools. Reporting the highest LSAT scores may have made repeat takers more attractive than they were in the past when the mean LSAT scores were reported. Figure 12 shows a plot of the percentage of repeat LSAT examinations administered in a given year and the percentage of law school enrollees who had repeated the LSAT for the period 2000–2014. Also shown to provide a context is the ratio of applicants to enrollees over the same period and a vertical line demarking when the ABA changed to having the highest of repeat LSAT scores reported rather than the mean. Between 2000 and 2005, the percentage of law school enrollees who had taken the LSAT multiple times never exceeded 25%. That changed in 2006 when the percentage rose to slightly more than 25%, then to 27% in 2007, and accelerated thereafter, rising to 33% in 2008 and 39% in 2009. Results for 2010 have not been released but are likely to be 40% or more.
Another way of looking at it is in terms of the advantage repeat LSAT takers had in law school admission. This can be examined by comparing the percentage of first-time LSAT takers who gained admission to law school to the percentage of repeat LSAT takers admitted. From 2001 to 2007, the rate at which LSAT repeaters were admitted to law school exceeded their presence among all LSAT takers by no more than 3%. Beginning in 2008, their rate of admission increased to 4.5% and rose further to 10.1% the next year. It continued to increase to 13.9% and 15.0% in 2010 and 2011, respectively. It is clear that the switch from reporting mean LSAT scores to reporting highest LSAT scores made a difference in the attractiveness of applicants who had repeated the LSAT, at least in terms of the rate at which they were admitted to law school.
Although they are reported on different scales, it is also clear that the applicant pool was declining over this period, and when the ratio of applicants to enrollees fell below 1.7 in 2008, the rate of admitting applicants with multiple LSAT scores accelerated.
Figure 12: Mean percentage of entering law students who repeated the LSAT as a function of the percentage of LSATs Administered to repeat examinees, 2000-2014, with ratio of applicants to enrollees shown
Other Factors
Even if the academic accomplishment of students has not changed nor law school admission committees changed how they make their selections, there are other things that could have caused the decline in the July 2014 MBE performance. Law school curricula have been evolving and now can include bar preparation courses for credit. Ironically, incorporating bar preparation into the law school curriculum may actually harm MBE performance. If bar preparation material in the curriculum supplants time students would have previously used learning core concepts in law school courses while doing bar preparation on their own time, students’ preparation for the bar examination may actually be reduced. There has also been a trend toward incorporating non-core courses and clinical experiences into the law school curriculum. These, too, can take students’ time away from learning the core concepts that are tested on the bar examination.
Another possible factor was a glitch in the software that many jurisdictions use to allow their examinees to complete the written portion of the bar examination (which is administered the day before the MBE) on computers. Although we have no hard data that connects jurisdictions that had the most problems with more dramatic declines in MBE scores, the glitch cannot be ruled out as a contributing factor. (ExamSoft recently reached a $2.1-million settlement in a class action suit brought by examinees from 43 states.)
The most troubling problem comes from reports from a number of law schools that their failure rates were up substantially in 2014 but their student composition was unchanged. At least some of these schools had decreased their enrollments in the face of the declining applicant pool in order to keep the quality of their student populations to their standards. While we do not doubt the sincerity of their claims, and the relatively modest one-point decrease in first quartile LSAT scores among the middle 50% of law schools would seem to support these claims, there are several factors that could obscure changes in their student populations. The change in reporting LSAT scores of multiple takers from the mean to the highest value is one such factor. Another is that the summary statistics used for LSAT scores and GPAs are medians and quartiles. These statistics will be insensitive to any change in the character of the class below the 50th percentile for the median and the 25th percentile for the first quartile. Since this is the region in which most bar failures are produced, it would take a more detailed look at this group to have a more complete picture of what happened. Another problem is that the students who graduate from a certain law school and take the bar examination are only a fraction of those who entered the law school. Attrition from transfers to other law schools and voluntary and involuntary withdrawals make comparisons of class-level LSAT admission statistics of limited value for interpreting the performance of graduates on the bar examination. The problem will not get any easier going forward, because LSAC will now only report mean LSAT scores to the nearest whole number rather than to the tenths. LSAT mean scores reported at this relatively low level of granularity will obscure what has previously been useful variability.
Conclusion
In summary, MBE scores in July 2014 declined by an unprecedented amount. The resulting increased bar failure rates are having a significant effect on law school graduates, law schools, and jurisdictions alike. Determining the cause of the decline is challenging because there are so many moving parts. Law school applications are down by an unprecedented amount, and law school admissions have declined, but at a slower rate than the applicant pool, making law school admissions the least competitive since at least the beginning of this millennium. Applicants who have retaken the LSAT have become a larger part of the law school student population since highest LSAT scores have been substituted for the mean of all retakes in all documentation provided to both the ABA and LSAC. Law school curricula have been evolving in a way that places less emphasis on the foundational content tested on the MBE. The software used by many jurisdictions to allow their examinees to complete the written portion of the bar examination by computer experienced a glitch that could have stressed and panicked some examinees on the night before the MBE was administered. LSAT scores reported for the examinees taking the July 2014 MBE were down, but not anywhere near levels that would have predicted the decline in MBE scores, but this is also obscured by the change to reporting retake scores in terms of the highest rather than the mean score.
It seems that almost everything that has to do with law school and bar preparation was in flux at the time of the July 2014 MBE administration. Whether they all converged in July 2014 as a rogue wave that will dissipate, or are the leading edge of a storm surge to be repeated as the decline in applicants works its way through the system is yet to be seen. However, amongst this sea of change, after exhaustive review and re-analysis of our processes and results, we can confidently say that the MBE itself did not change. It was and always will be the safeguard that upholds the standards of the legal profession and protects the public and profession from lawyers who should not be allowed to practice.
Acknowledgments
The author thanks the following people who provided assistance with this article: NCBE Testing Department staff members Dr. Joanne Kane, Chas Karch, and Douglas Ripkey, and NCBE Executive Assistant Deborah Kuranz. The author also thanks the Law School Admission Council for generously providing several archived LSAT Technical Reports.
References
- American Bar Association Section of Legal Education and Admissions to the Bar, ABA Required Disclosures (showing results from the ABA’s annual survey of law schools).
- American Bar Association Section of Legal Education and Admissions to the Bar, Enrollment and Degrees Awarded 1963–2012 Academic Years, available at http://www.americanbar.org/content/dam/aba/administrative/legal_education_and_admissions_to_the_bar/statistics/enrollment_degrees_awarded.authcheckdam.pdf.
- Paul L. Caron, ABA to Require Schools to Report Highest LSAT Scores from Multiple Tests, Rather than Average Scores, TaxProfBlog, June 14, 2006, available at http://taxprof.typepad.com/taxprof_blog/2006/06/aba_to_require_.html (accessed Dec. 23, 2014).
- Susan P. Dalessandro, Lisa C. Anthony & Lynda M. Reese, LSAT Performance with Regional, Gender, and Racial/Ethnic Breakdowns: 2005–2006 Through 2011–2012 Testing Years, Law School Admission Council LSAT Technical Report 12-03, October 2012.
- Susan P. Dalessandro & Lori D. McLeod, The Validity of Law School Admission Test Scores for Repeaters: A Replication, Law School Admission Council LSAT Technical Report 98-05, September 1998.
- Sam Flanigan & Robert Morse (2014), Methodology: 2015 Best Law Schools Rankings: Find Out How U.S. News Ranks Law Schools.
- Laura A. Lauth, Andrea Thornton Sweeney, Christian Fox & Lynda M. Reese, The Performance of Repeat Test Takers on the Law School Admission Test: 2006–2007 Through 2012–2013 Testing Years, Law School Admission Council LSAT Technical Report 14-01, March 2014.
- Law School Admission Council, Applicants by Ethnic & Gender Group, available at http://www.lsac.org/lsacresources/data/ethnic-gender-applicants (accessed Nov. 24, 2014).
- Law School Admission Council, Applicants by Ethnic and Gender Group (Archive) (accessed Nov. 24, 2014).
- Elizabeth Olson, Law School Is Buyers’ Market, with Top Students in Demand, New York Times, Dec. 1, 2014.
- Jerry Organ, Understanding Trends in Demographics of Law Students—Part Two, The Legal Whiteboard, Oct. 17, 2013.
- Karen Sloan, Software Maker Settles Barmageddon Class Action for $2.1M, National Law Journal, May 15, 2015, available at http://www.nationallawjournal.com/printerfriendly/id=1202726589832.
- Lisa Anthony Stilwell, Andrea E. Thornton & Peter J. Pashley, The Validity of Law School Admission Test Scores for Repeaters: 1997 Through 2000 Entering Law School Classes, Law School Admission Council LSAT Technical Report 02-02, November 2002.
- Andrea E. Thornton, Laura A. Marcus, Arlene Amodeo & Lynda M. Reese, The Performance of Repeat Test Takers on the Law School Admission Test: 2000–2001 Through 2006–2007 Testing Years, Law School Admission Council LSAT Technical Report 08-01, March 2008.
- Andrea Thornton Sweeney, Laura A. Marcus & Lynda M. Reese, The Validity of Law School Admission Test Scores for Repeat Test Takers: 2005 Through 2008 Entering Law School Classes, Law School Admission Council LSAT Technical Report 10-02, October 2010.
- Andrea E. Thornton, Lisa Anthony Stilwell & Lynda M. Reese, The Validity of Law School Admission Test Scores for Repeaters: 2001 Through 2004 Entering Law School Classes, Law School Admission Council LSAT Technical Report 06-02, November 2006.
 Mark A. Albanese, PhD, is the Director of Testing and Research for the National Conference of Bar Examiners.
Contact us to request a pdf file of the original article as it appeared in the print edition.