This article originally appeared in The Bar Examiner print edition, June 2015 (Vol. 84, No. 2), pp 4–14.
By Erica Moeser
 2015 is proving to be an auspicious year for the Uniform Bar Examination—Kansas came aboard in January, and New York made its big announcement in May. The number of UBE jurisdictions now stands at 16, with favorable recommendations currently pending in two other states. The addition of New York has laid to rest the criticism that no large jurisdiction (as defined by applicant numbers) has signed on. New York did so after exhaustive study, as the record makes clear. Of course, the UBE has already been adopted in many states with cities with significant legal markets—Denver, Kansas City, Minneapolis, Phoenix, Seattle, and St. Louis, to name a few. We welcome both Kansas and New York—both will begin UBE administrations in 2016.
NCBE’s Annual Bar Admissions Conference drew a record crowd to Chicago in early May. The words “best ever” were uttered more than usual for this edition. This is the first time I can recall that every state was represented, along with the District of Columbia, the Virgin Islands, Puerto Rico, and Guam. Credit goes to Bucky Askew, Chair of our Education Committee, to Ellen Embertson and Laurie Lutz of the staff, and to the speakers who brought so much important information to the attendees. This annual event is the best opportunity that bar examiners and members of their Courts have to learn about the basics of bar examining and the larger complex framework of issues that affect lawyer licensing.
As noted in my previous column that appeared in the March issue of this magazine, the decline in the mean score for the July 2014 administration of the Multistate Bar Examination continues to reverberate. The reverberations are noteworthy because they presage what in all likelihood lies ahead. Then as now, we are confident of the correctness of the scores as reported. Because of the importance of getting things right, we engaged in more replications of our equating procedures internally—and indeed, more review of our procedures for selecting test items—than usual. Had we detected error, we would have reported and acted upon it. We found no error.
By way of an update, in an excess of caution we then took the additional step of engaging the Center for Advanced Studies in Measurement and Assessment (CASMA) of the University of Iowa to review our results. CASMA represents the gold standard for equating research within the measurement community. CASMA not only replicated NCBE’s results using our equating methodology but also confirmed the results using alternative means of conducting the equating.
To quote from the report, which is confidential, “The results for [the replication] were almost identical to those provided by NCBE. The results for the additional analysis in [the alternative methods] showed that the final conversion tables were remarkably similar across different combinations of options. . . . This clearly suggests that we did not find any explanation for the mean drop observed in July 2014 attributable to the statistical equating procedures examined in this report.” Stated in lawyer parlance: case closed.
If you believe, as I do, that the dynamics of law school enrollment decisions in the face of sharply declining applications (coupled with a reported shift downward in high-scoring LSAT takers and an increase in low-scoring LSAT takers) account for the decline in the MBE mean score, then you will concur that the news about MBE performance is unlikely to be rosy any time soon—barring ambitious educational initiatives, particularly at the law schools at which the decline in the LSAT profile is most pronounced. As I have noted before, I have been following the law school admissions decisions that are described publicly by the top of the bottom (25th) percentile. (There is no publicly available information of which I am aware that describes how far below the 25th percentile the tail of each law school’s applicant pool extends.)
The bottom quartile of incoming classes typically includes the students who are most likely to pay the full sticker price for their legal educations (as opposed to the high-LSAT performers who are most likely to be courted with tuition discounts). The bottom quartile is most likely to experience disappointment in the job market, and most likely to struggle on the bar examination.
To the extent that the subject matter included on the MBE represents what a consensus of lawyers, judges, and legal educators deem to be the core curriculum—Civil Procedure, Constitutional Law, Contracts, Criminal Law and Procedure, Evidence, Real Property, and Torts—it strikes me that early intervention and summative evaluations undertaken by the members of the faculty community who are responsible for the first year of learning may offer the best chance of upgrading the educational experience for students who are most at risk. I see this as an exciting time for entire law school faculties to meet the challenge of teaching students from Day One. Given the recent focus on measurable outcomes in legal education, this may present an opportunity for fresh thinking about the role of teachers of core courses, especially as to the at-risk learner.
In my view, the answer is not to slap a bar review course onto the end of the law school experience. (These courses are outsourced to bar review companies in a surprisingly large number of law schools, or taught by untenured contract or administrative personnel at others.) Taught as a way of looking for gimmicks in testing, the courses are a complete waste of time; taught as experiences that synthesize earlier learning and provide opportunities to have students’ writing critiqued, they add value. In all events, late-season initiatives are too little, too late if they represent the school’s only effort to address the needs of at-risk students.
On the bar examining side, we bear responsibility for slicing away test material that does not focus on what the new lawyer needs to know (a concept that Dr. Susan Case, now retired as NCBE’s Director of Testing, championed). To that end, we continue to cull from our test specifications the unnecessary, and we are committed to eliminating from our bank of test items the overly complex and the arcane. We encourage states that craft local test components to do the same.
Predictably, the decline in the MBE mean has unleashed criticism of the bar examination from some academic quarters, perhaps on the theory that the best defense is a strong offense. I maintain that NCBE’s tests are thoughtfully constructed by experts in the various fields, rigorously reviewed, edited, and pretested. If we are to license professionals, we must accept the trade-off that a two-day sampling of what an entry-level lawyer needs to know limits the scope of coverage and the means of test delivery. NCBE’s job is to make the exercise worthwhile and fair—every aspect of the examination must count—and relevant to a sound licensing decision.
And now a word about what the future may hold for the MBE performance of the law school graduates who emerge this year—suddenly everywhere I go someone quotes the great Wayne Gretzky about skating to where the puck is going to be. As to the MBE mean score, the puck is unlikely to be at a better place than it was in 2014, and the next few years show little promise of improvement absent the blossoming of initiatives in law schools such as noted above. Because of the gravity of the situation, I am repeating the publication of publicly available information about the number of first-year students enrolled and the LSAT scores reported at the top of the bottom quartile.
Readers will note that some schools have chosen to shrink enrollments in order to maintain the 25th percentile LSAT score. Others have maintained enrollments—and a few have even increased them.
In this version of the chart, which includes 2014 data, law schools are arranged by jurisdiction to enable bar examiners to capture a snapshot of the enrollment and LSAT trajectories of the law schools in their jurisdictions. From the high tide of first-year students who entered law school in 2010, we see the beginning of an enrollment slide that will last at least through the group that will graduate in 2017—and likely 2018. The students who entered in 2012 will be testing in July of this year. Of course, not every first-year student completes law school (or completes it in three years), and not every law school graduate takes the bar examination in the jurisdiction in which he or she graduates.
The figures in the chart are but one indicator. Also, as I have written before, we cannot assess the impact of the decision in 2011 to report only the highest LSAT score earned rather than the average of multiple LSAT scores, other than to observe that this skews more recent numbers to some extent. As noted above, we have no access to data describing how far below the 25th percentile LSAT score law schools reach to fill their classes. We can only hope that the schools that have chosen to descend the 60-point LSAT scale fairly dramatically at the 25th percentile point comprehend the dangers and meet the challenges that lie ahead.
Following the chart are three graphic representations of the declines in enrollment and LSAT scores at the 25th percentile as rendered and interpreted by Dr. Joanne Kane of NCBE’s Testing Department.
As a final note, we at NCBE mourn the passing of former NCBE Chair of the Board of Trustees Richard J. Bartlett, who is memorialized elsewhere in this magazine. Dick, who also chaired the New York Board of Law Examiners, was an important contributor to the work that this organization performs. Dick was good for New York’s bar examining process and good for NCBE. There are some wonderful Dick Bartlett stories lodged in our memories, and it will be bittersweet to recall them at those times when those of us who knew him gather to reminisce.
Change in First Year Enrollment from 2010 to 2014 and Reported Changes to the LSAT Score at the 25th Percentile
"Forbidden"
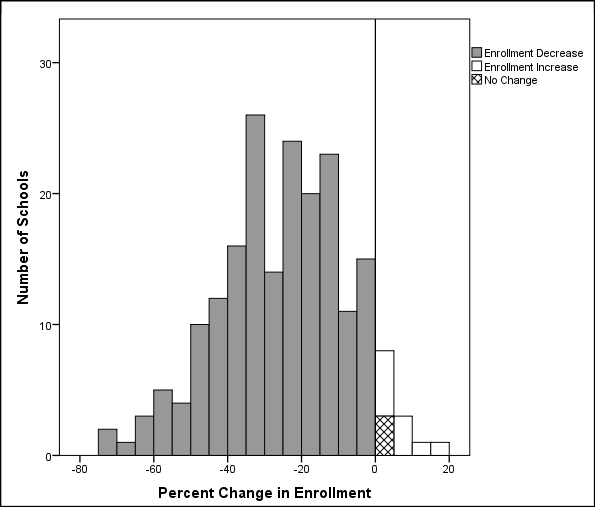
Percent Change in Enrollment from 2010 to 2014
The graph below displays the change in enrollment from 2010 to 2014 (with percent change in enrollment rounded to the nearest whole percentage point). Each bar represents percentage change values in increments of 5%. For example, the stacked bar to the right of the reference line at 0% change shows the total number of schools with rounded percent change values falling between 0% and 4% inclusive. (The stacked bar is split, with the crosshatched portion of the bar indicating the number of schools falling at the 0% change value versus those schools with 1–4% change indicated by the white portion of the bar.)
Over 90% of schools (186) experienced decreases in enrollment from 2010 to 2014, represented by the gray bars. Three schools (1.5%) saw no change in enrollment (after rounding), represented by the crosshatched bar. Ten schools (5%) saw increases in their enrollment, represented by the white bars. Three schools that were not accredited in 2010 are excluded.
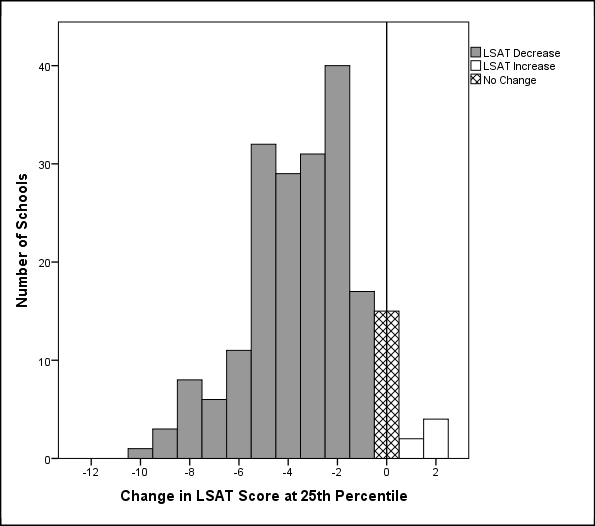
Change in LSAT Score at the 25th Percentile from 2010 to 2014
The graph below displays the change in LSAT score at the 25th percentile from 2010 to 2014. Over 88% of schools (178) experienced decreases in LSAT scores at the 25th percentile from 2010 to 2014, represented by the gray bars. Fifteen schools (7.4%) saw no change in LSAT scores at the 25th percentile, represented by the crosshatched bar. Six schools (3%) saw increases in LSAT scores at the 25th percentile, represented by the white bars. Three schools that were not accredited in 2010 are excluded.
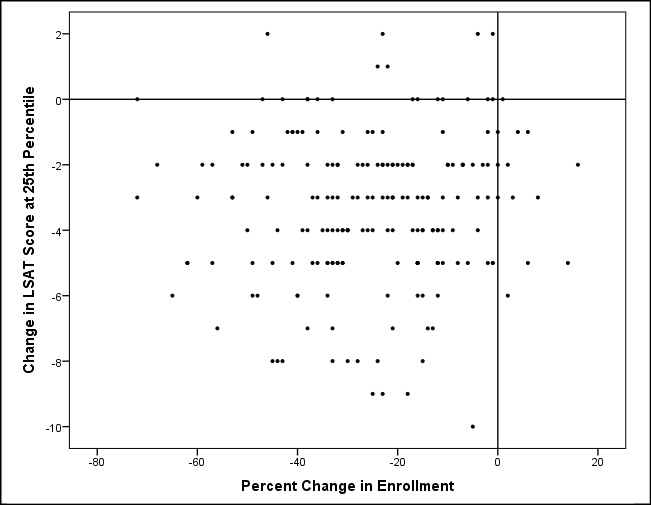
Change in Enrollment and LSAT Score at the 25th Percentile from 2010 to 2014
In the scatterplot below, each school supplying complete data is represented by a dot (dots overlap when two or more schools reported identical values for both percent change in enrollment and change in LSAT score at the 25th percentile). The horizontal line in the scatterplot represents no change in LSAT score at the 25th percentile from 2010 to 2014, and the vertical line in the scatterplot represents no change in enrollment from 2010 to 2014. These two lines divide the scatterplot into four quadrants. Most of the schools appear in the lower left quadrant; this quadrant contains schools that have experienced decreases in both the LSAT score at the 25th percentile and their enrollment numbers. A few schools appear in the upper left or lower right quadrants. The upper left quadrant contains schools that have experienced an increase in their LSAT scores but a decrease in their enrollment numbers. The lower right quadrant contains schools that have experienced a decrease in their LSAT scores but an increase in their enrollment numbers. There are no schools in the upper right quadrant, which is the quadrant that would represent schools that had both increased their LSAT scores and increased their enrollment numbers.
This scatterplot makes plain that schools are making trade-offs to cope with changes in law school student population characteristics. Some schools are shrinking class size to maintain or increase their 25th percentile LSAT scores, and other schools are sacrificing 25th percentile LSAT scores to maintain or increase their enrollment figures. The harsh reality shown by the concentration of data in the lower left quadrant and the complete absence of data in the upper right quadrant is that most schools are seeing significant negative change and are making sacrifices on both fronts.
Contact us to request a pdf file of the original article as it appeared in the print edition.


