This article originally appeared in The Bar Examiner print edition, Fall 2020 (Vol. 89, No. 1), pp. 68–75.
 In this issue’s Testing Column, we revisit the important concept of scaling—a procedure that statistically adjusts a jurisdiction’s raw scores on the written components of the bar exam (the MEE and the MPT) so that collectively they have the same mean and standard deviation as the jurisdiction’s scaled MBE scores.
This section begins with two reprinted Bar Examiner articles on scaling written by Susan M. Case, PhD, NCBE’s Director of Testing from 2001 to 2013. In the first article, Dr. Case answers frequently asked questions about scaling; in the second article, she explains the scaling process with an illustrative example.
The accompanying sidebars below provide additional explanations of equating and scaling and dispel a frequent myth about scaling.
Frequently Asked Questions about Scaling Written Test Scores to the MBE
By Susan M. Case, PhDReprinted from 75(4) The Bar Examiner (November 2006) 42–44
Scaling is a topic that often arises at NCBE seminars and other meetings and has been addressed in the Bar Examiner; yet it still seems to be a mysterious topic to many. This column addresses the most frequently asked questions about scaling in an attempt to clarify some of the issues.
What Is Scaling?
In the bar examination setting, scaling is a statistical procedure that puts essay or performance test scores on the same score scale as the Multistate Bar Examination (MBE). Despite the change in scale, the rank-ordering of individuals remains the same as it was on the original scale.
What Is the Outcome for Bar Examiners Who Do Not Scale their Written Test Scores to the MBE?
To understand the effect of not scaling written scores to the MBE but keeping them on separate scales, one must consider the equating process that adjusts MBE “raw” scores to MBE “scaled” scores. As you know, equating ensures that MBE scores retain the same meaning over time, regardless of the difficulty of the test form that a particular examinee took and regardless of the relative proficiency of the pool of candidates in which a particular examinee tested. The equating process requires that a mini-test comprised of items that have appeared on earlier versions of the test be embedded in the larger exam. The mini-test mirrors the full exam in terms of content and statistical properties of the items. The repeated items provide a direct link between the current form of the exam and previous forms. They make it possible to compare the performance of this administration’s candidates with the performance of a previous group on exactly the same set of items. Even though different forms of the MBE are designed to be as similar as possible, slight variations in difficulty are unavoidable. Similarly, candidate groups differ in proficiency from one administration to the next, and from one year to the next. Equating methods are used to adjust MBE scores to account for these differences, so that a scaled score of 135 on the MBE in July 2004 represents the same level of proficiency as a scaled score of 135 on the MBE in February 2007 or on any other test.
Equating is not possible for written tests because written questions are not reused. As a consequence, essay scores will fluctuate in meaning from administration to administration because it is impossible for graders to account for differences in the difficulty of the questions or for differences in the average proficiency of candidates over time. This phenomenon is demonstrated by the fact that average essay scores in February tend to be the same as average essay scores in July, even though we know that February candidates are consistently less proficient (as a group) than July candidates. It has also been shown that an essay of average proficiency will be graded lower if it appears in a pool of excellent essays than if it appears in a pool of poor essays. Context matters.
So what is the outcome of such fluctuation in the meaning of written test scores? An individual of average proficiency may have the misfortune of sitting for the bar with a particularly bright candidate pool. This average individual’s essay scores will be lower than they would have been in a different sitting. The same individual’s MBE score will reflect his genuine proficiency level (despite sitting with a group of particularly bright candidates), but without scaling, his essay scores may drag him down. An unscaled essay score may be affected by factors such as item difficulty or the average proficiency of the candidate pool that do not reflect the individual candidate’s performance.
What Is the Outcome for Bar Examiners Who Scale Their Written Test Scores to the MBE?
The preferred approach is to scale written test scores to the MBE—this process transforms each raw written score into a scaled written score. A scaled written test score reflects a type of secondary equating that adjusts the “raw” written test score after taking into account the average proficiency of the candidate pool identified by the equating of the MBE. Once the average proficiency of a group of candidates is determined, scaling will adjust not only for an upswing or downswing in proficiency from past years, but also for any change in the difficulty of written test questions or any change in the harshness of the graders from past years.
In our example of the individual of average proficiency who sits for the bar with a particularly bright candidate pool, this individual’s raw written scores will remain lower than they would have been in previous sittings with less able peers. But the equating of the MBE will take into account that this is a particularly bright candidate pool and that the individual in question is in fact of average ability. The individual’s written test scores will then be scaled to account for the difference in the candidate pool, and his written test scores will be brought into alignment with his demonstrated level of ability. Scaled essay scores lead to total bar examination scores that eliminate contextual issues and that accurately reflect individual proficiency.
Doesn’t This Process Disadvantage People Who Do Poorly on the MBE?
No. It is important to note that an individual might have one of the best MBE scores and one of the worst essay scores, or vice versa. Scaling written scores to the MBE does not change the rank-ordering of examinees on either test. A person who had the 83rd best MBE score and the 23rd best essay score will still have the 83rd best MBE score and the 23rd best essay score after scaling.
One analogy that might help relates to temperature. Suppose the garages on your street have thermometers that measure their temperatures in Celsius and the houses on your street have thermometers that measure their temperatures in Fahrenheit. The house temperatures range from 66° F to 74° F and the garages range from 19° C to 23° C. Suppose that you have the coldest garage and the warmest house. If the garage thermometers are all changed to the Fahrenheit scale, the temperature readings for all the garages will change, but your garage will still measure the coldest and your house will still measure the warmest. In Celsius terms, your garage temperature was 19° C; in Fahrenheit terms your garage temperature is 66° F. Either way, it is shown to be the coldest garage. (Note that this example demonstrates only the move to a different scale and the maintenance of identical rank order; it does not demonstrate the adjustments that take place during the equating of exam scores.)
In the example of the individual of average proficiency who sits with an unusually bright candidate pool, scaling the average individual’s written test scores to the MBE would not change his rank within the candidate group with which he took the examination. He would still be ranked below where he would have ranked in a less-capable candidate pool. However, his unusually low rank would no longer affect his total bar examination score. The total scores for the entire pool of candidates would reflect what was in fact the case: that it was a particularly bright pool of individuals (i.e., the total scaled scores would be higher than they were for previous administrations).
What Does the Process of Scaling Written Scores to the MBE Entail?
Scaling the written tests can be done either on an individual essay score (or MPT item score), or on the total written test score. NCBE will scale the scores for individual jurisdictions, if they wish, or will provide the jurisdictions with software to do the scaling themselves. Essentially the process results in generating new scaled essay scores that look like MBE scores. The distribution of written scores will be the same as the distribution of MBE scores—with a very similar average, a very similar minimum and maximum, and a very similar distribution of scores.
The process is described in the Testing Column that appears in the May 2005 Bar Examiner (Volume 74, No. 2). Conceptually, the result is similar to listing MBE scores in order from best to worst, and then listing written scores in order from best to worse to generate a rank-ordering of MBE scores and essay scores. The worst essay score assumes the value of the worst MBE score; the second worst is set to the second worst, etc.
Demystifying Scaling to the MBE: How’d You Do That?
By Susan M. Case, PhDReprinted from 74(2) The Bar Examiner (May 2005) 45–46.There seems to be a mystery about how to scale the essay scores to the Multistate Bar Examination (MBE), and the Testing Column of the statistics issue seems to be an appropriate place to run through the process.
Here are the steps in a nutshell:
Step 1. Determine the mean and standard deviation (SD) of MBE scores in your jurisdiction.
Step 2. Determine the mean and SD of the essay scores in the jurisdiction (you can do this for the total essay score, the average essay score, or each essay individually).
Step 3. Rescale the essay scores so that they have a mean and SD that is the same as the MBE for the same group of examinees.
Now for an example. Let’s assume you tested 15 examinees. In Table 1, the data for each examinee are shown. The first column shows the examinee ID number. Column 2 shows the total raw essay score that each examinee received. These data were obtained from a mock essay exam where each of the 10 essays is graded on a one to six scale, but the calculations apply equally well for any number of essays and any type of grading scale. The bottom of the column shows the average score (40) and standard deviation of the scores (5.2). These are typically shown in your data output and would not usually be calculated by hand.
Table 1. Sample Essay Data Shown for Each Examinee
Your calculations begin with column 3. For each examinee, subtract the group mean essay score (40 in this example) from the total essay score that the examinee received; then divide this value by the group SD (5.2 in this example). The result is the total essay score in standard deviation units. For example, the first examinee has a total raw essay score of 29; the mean essay score is 40 and the SD is 5.2; thus, the examinee’s score in SD units is -2.1 or 2.1 standard deviations below the mean (see the Testing Column in May 2003 for a discussion of scores in SD units).
Regardless of the score range, scores in standard deviation units typically range from -3 to +3 (zero is the average score). An examinee with a score of -2.1 SDs has a very low score; an examinee with a score of zero SDs has a score at the mean of the group; and an examinee with a score of 2.3 SDs has a high score. Overall, the scores in SD units have a mean of zero and a standard deviation of one; this will always be true if the scores have a normal (bell-curve) distribution (see Figure 1).
Figure 1. Sample Essay Data Shown in SD Units, as Scaled Scores, and as Raw Scores
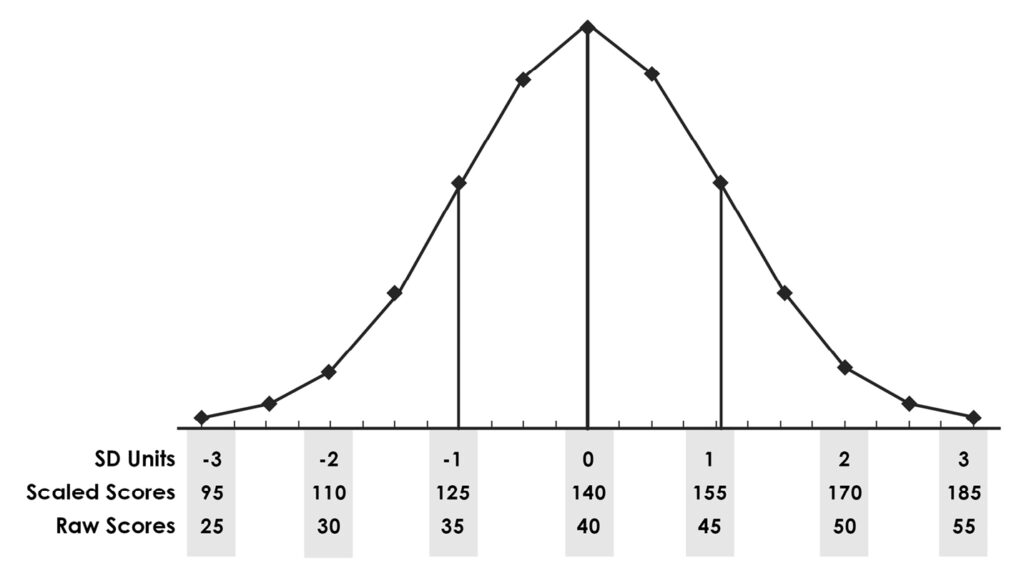
Column 4 shows the calculations to turn this standard deviation score into a score that is scaled to the MBE. Multiply the examinee’s score in SD units by 15 (the SD of the MBE for this group); add this result to 140 (the mean of the MBE for this group). The mean and SD for the essay scores scaled to the MBE will have the same mean and SD as the MBE scores. Column 5 shows the actual MBE scores achieved by each examinee.
Note that the examinees who performed relatively poorly on the essay have a scaled essay score that is also relatively low, regardless of their actual performance on the MBE. Examinee 1 performed poorly on both the essay and the MBE. Examinees 3, 4, and 5 performed poorly on the essay but much better on the MBE; note that this comparison can be made easily by comparing the results in columns 4 and 5. Examinee 6 did much better on the essay than on the MBE. Converting the essay scores to the MBE scale did not change the rank-ordering of examinees on the essay scale; it simply made their scores easier to compare. The correlation between the raw essay score and MBE is exactly the same as between the scaled essay score and the MBE.
Scaling the essays to the MBE is an essential step in ensuring that scores have a consistent meaning over time. When essay scores are not scaled to the MBE, they tend to remain about the same: for example, it is common for the average raw July essay score to be similar to the average February score even if the July examinees are known to be more knowledgeable on average than the February examinees. Using raw essay scores rather than scaled essay scores tends to provide an unintended advantage to some examinees and an unintended disadvantage to others.
 Susan M. Case, PhD. Former NCBE Director of Testing (2001–2013)
The following sidebar is an excerpt from NCBE Testing and Research Department, “The Testing Column: Q&A: NCBE Testing and Research Department Staff Members Answer Your Questions,” 86(4) The Bar Examiner (Winter 2017–2018) 34–39.
What is equating? Why do it? How does it work?
Equating is a statistical procedure used for most large-scale standardized tests to adjust examinee scores to compensate for differences in difficulty among test forms so that scores on the forms have the same meaning and are directly comparable. (The term test form refers to a particular set of test items, or questions, administered at a given time. The February 2017 Multistate Bar Examination [MBE] test form, for example, contains a unique set of items, and the July 2017 test form contains a different set of items.) With equating, a reported scaled score has a consistent interpretation across test forms.
Equating is necessary because using exactly the same set of items on each test form could compromise the meaning of scores and lead to unfairness for some examinees. For example, there would be no guarantee that items were not shared among examinees over time, which would degrade the meaning of scores. Not only would the scores obtained by some examinees be corrupted by the examinees’ advance knowledge of test items, but, if undetected, these inflated scores would advantage the clued-in examinees over other examinees. To avoid this problem, the collection of items on test forms for most large-scale standardized tests changes with every test administration.
Despite test developers’ best efforts to build new forms that conform to the same content and statistical specifications over time, it is nearly impossible to ensure that statistical characteristics like difficulty will be identical across the forms. Equating adjusts scores for such differences in difficulty among test forms so that no examinee is unfairly advantaged by being assigned an easier form or is unfairly disadvantaged by being assigned a more difficult form.
While there are many methods available to conduct equating, a commonly used approach for equating large-scale standardized tests—and the approach that is used for the MBE—is to embed a subset of previously administered items that serve as a “mini-test,” with the items chosen to represent as closely as possible the content and statistical characteristics of the overall examination. The items that compose this mini-test are referred to as equators. The statistical characteristics of the equators from previous administrations are used to adjust scores for differences in difficulty between the current test form and previous forms after accounting for differences between current and previous examinee performance on the equator items.1 Conceptually, if current examinees perform better on the equators compared to previous examinees, we know that current examinee proficiency is higher than that of previous examinees and that current examinees’ MBE scaled scores should be higher (as a group) than those of previous examinees (and vice versa if performance on the equators is worse for current examinees). The equators are used as a link to previous MBE administrations and, ultimately, to MBE scaled scores.
Note
- For more detailed descriptions and examples of equating, see Mark A. Albanese, PhD, “The Testing Column: Equating the MBE,” 84(3) The Bar Examiner (September 2015) 29–36; Deborah J. Harris, “Equating the Multistate Bar Examination,” 72(3) The Bar Examiner (August 2003) 12–18; Michael T. Kane, PhD & Andrew Mroch, “Equating the MBE,” 74(3) The Bar Examiner (August 2005) 22–27; Michael J. Kolen & Robert L. Brennan, Test Equating, Scaling, and Linking: Methods and Practices (Springer 3rd ed. 2014); Lee Schroeder, PhD, “Scoring Examinations: Equating and Scaling,” 69(1) The Bar Examiner (February 2000) 6–9.(Go back)
The following sidebar is an excerpt from NCBE Testing and Research Department, “The Testing Column: Q&A: NCBE Testing and Research Department Staff Members Answer Your Questions,” 86(4) The Bar Examiner (Winter 2017–2018) 34–39.
Can we equate essay or performance tests? (Or, what is essay scaling?)
As with MBE items, the written components of the bar exam (essay questions and performance test items) change with every administration. The difficulty of the questions/items, the proficiency of the group of examinees taking the exam, and the graders (and the stringency with which they grade) may also change. All three of these variables can affect the grades assigned by graders to examinees’ responses to these written components of the exam and can have the potential to cause variation in the level of performance the grades represent across administrations. Unlike the MBE, the answers to the written questions/items of the bar examination cannot be equated, because previously used questions/items can’t be reused or embedded in a current exam—there are too few written questions/items on the exam and they are too memorable. If essay questions or performance test items were reused, any examinee who had seen them on a previous administration would be very likely to have an unfair advantage over examinees who had not seen them previously.
Because directly equating the written components is not possible, most jurisdictions use an indirect process referred to as scaling the written component to the MBE. This process has graders assign grades to each question/item using the grading scale employed in their particular jurisdiction (e.g., 1 to 6). The individual grades on each written question/item are typically combined into a raw written score for each examinee. These raw written scores are then statistically adjusted so that collectively they have the same mean and standard deviation as do the scaled scores on the MBE in the jurisdiction. (Standard deviation is the measure of the spread of scores—that is, the average deviation of scores from the mean. The term scaled score refers to the score as it has been applied to the scale used for the test—in the case of the MBE, the 200-point MBE scale.)
Conceptually, this process is similar to listing MBE scaled scores in order from best to worst and then listing raw written scores in order from best to worst to generate a rank-ordering of MBE scores and written scores. The best written score assumes the value of the best MBE score; the second-best written score is set to the second-best MBE score, and so on. Functionally, the process yields a distribution of scaled written scores that is the same as the jurisdiction’s distribution of the equated MBE scaled scores. Another way to think about the process is that the raw written scores are used to measure how far each examinee’s written performance is from the group’s average written performance, and then the information from the distribution of the group’s MBE scores is used to determine what “scaled” values should be associated with those distances from the average.
This conversion process leaves intact the important rank-ordering decisions made by graders, and it adjusts them so that they align with the MBE scaled score distribution. Because the MBE scaled scores have been equated, converting the written scores to the MBE scale takes advantage of the MBE equating process to indirectly equate the written scores. The justification for scaling the written scores to the MBE has been anchored on the facts that the content and concepts assessed on the MBE and written components are aligned and performance on the MBE and the written components is strongly correlated. The added benefit of having scores of both the MBE and the written component on the same score scale is that it simplifies combining the two when calculating the total bar examination score. In the end, the result of scaling (like equating) is that the scores represent the same level of performance regardless of the administration in which they were earned.
Aren’t scaling and equating the same as grading on a curve?
By NCBE Testing and Research Department staff members Mark A. Albanese, PhD; Joanne Kane, PhD; and Douglas R. Ripkey, MS
No. Grading on a curve will create a specified percentage of people who pass, no matter their proficiency. Relative grading, scaling, and equating, however, eliminates the concept of a fixed percentage; every single taker could pass (or fail) within an administration and based upon their own merits. We will do our best to illustrate the differences here, but we recommend that readers familiarize themselves with the component parts and the scoring system as a whole in order to best understand the bigger picture; having a poor understanding of any of the three integral parts of the system will result in a poor understanding of scoring and make it challenging to adequately compare and contrast the scoring system NCBE uses with alternative grading methods.
Relative Grading of the Written Component Versus Grading on a Curve
In comparison to grading on a curve, the most similar piece of NCBE’s scoring approach is the initial relative grading NCBE recommends for the written component of the exam (the Multistate Essay Examination and the Multistate Performance Test). Relative grading is similar to grading on a curve in that graders are looking to spread out the scores across a grading scale (e.g., 1 to 6—or whatever grading scale is used in their particular jurisdiction). Whereas grading on a curve usually involves quotas on what percentage of examinees receive each grade, NCBE recommends only that graders spread out scores across the grading scale as much as possible and appropriate. But the additional and truly key difference is that grading on a curve is usually a process unto itself, whereas relative grading is just one step in a larger scoring process that involves equating the MBE and then scaling the written component score to the MBE.
Equating the MBE Versus Grading on a Curve
The only thing that equating and grading on a curve have in common is that they both involve taking raw scores on a test and translating them into a different scale (such as letter grades) to obtain final information about a test taker’s performance. The rationale for each approach, the mechanisms by which the scores are translated or transformed, and the interpretations of the scores from these two paths are each very different.
With grading on a curve, the extra processing is focused on determining relative performance. That is, the final performance is interpreted relative to other people who have taken the same evaluation. It’s akin to the adage that if you are being chased by a bear, you don’t have to be the fastest person, just faster than the person next to you. When a curve is used to grade, there typically is some sort of quota set. For example, a jurisdiction (fictional) might specify that only examinees with MBE raw scores in the top 40% will be admitted. When grading on a curve, an examinee’s actual score is less important than how many examinees had lower scores, since a specified percentage of examinees will pass regardless of the knowledge level of the group and the difficulty of the materials.
Note that with a system of grading on a curve, it is not possible to track changes in the quality of examinee performances as a group over time. If a strict quota system is followed, the average grade within the class will always be the same. If a student happens to be part of a weaker cohort, they will receive a higher grade than they would have if they had belonged to a stronger cohort. On the other hand, scaling and equating would result in an examinee receiving a score that was not dependent on who else was in their cohort.
With scaling and equating, extra processing is implemented to determine performance in a more absolute sense. The final performance is interpreted as an established level of demonstrated proficiency (e.g., examinees with MBE scaled scores at or above 135 will be admitted). When raw scores are scaled and equated to final values, the difficulty of the test materials is a key component in the process. The examinee’s actual level of knowledge is more important in determining status than how their knowledge level compares to other people. The knowledge levels of examinees determine the percentage of examinees who pass. The result is that everyone could pass (or fail) if their knowledge level was sufficiently high (or low).
Further Reading
Mark A. Albanese, PhD, “The Testing Column: Scaling: It’s Not Just for Fish or Mountains,” 83(4) The Bar Examiner (December 2014) 50–56.Mark A. Albanese, PhD, “The Testing Column: Equating the MBE,” 84(3) The Bar Examiner (September 2015) 29–36.Mark A. Albanese, PhD, “The Testing Column: Essay and MPT Grading: Does Spread Really Matter?,” 85(4) The Bar Examiner (December 2016) 29–35.Judith A. Gundersen, “It’s All Relative—MEE and MPT Grading, That Is,” 85(2) The Bar Examiner (June 2016) 37–45.Lee Schroeder, PhD, “Scoring Examinations: Equating and Scaling,” 69(1) The Bar Examiner (February 2000) 6–9.
Contact us to request a pdf file of the original article as it appeared in the print edition.