This article originally appeared in The Bar Examiner print edition, December 2014 (Vol. 83, No. 4), pp. 4–11. By Erica Moeser The results of the July 2014 bar examinations have trickled out over the past three months as jurisdictions completed their grading, and this time the ripple of reaction that normally attends such releases turned into a wave. The reason for this is that average scores on the Multistate Bar Examination (MBE) fell to the lowest level since the July 2004 MBE administration. (February results are characteristically lower.)
It was therefore inevitable that bar exam passing percentages would dip in many jurisdictions, because most jurisdictions follow the best practice of setting their written scores on the MBE scale. The technical reasons for this have been set forth in our Testing Columns (including the column in this issue). Essay questions, particularly those that involve judgments about performance of the very different test populations in February and July, challenge the ability of graders to maintain consistent standards. And graders change. The MBE score overcomes that. It is stable over time in terms of measuring the performance of each group that takes the test.
To the extent that individual law schools had large numbers of their graduates test in a given jurisdiction, the summer bar results were particularly troubling for them. Given the increased transparency that has occurred through efforts to promote disclosure of law school bar passage results to those who are contemplating the investment of time and money in a legal education, and given the sway that national rankings hold over law schools, it was perhaps preordained that the first thought to spring to many minds in legal education was Blame the Test.
The MBE, like other high-stakes instruments, is an equated test; raw scores are subjected to a mathematical procedure by psychometricians (experienced professionals, all with Ph.D.s) to adjust the final—or scaled—score to account for changes in difficulty over time. The result is that a scaled score on the MBE this past summer—say 135—is equivalent to a score of 135 on any MBE in the past or in the future.
Equating is done by embedding a set of test questions that have appeared on previous test forms into the current test form and then comparing the performance of the new group of test takers—here the July 2014 cohort—on those questions with the performance of prior test takers on those questions. The embedded items are carefully selected to mirror the content of the overall test and to effectively represent a mini-test within a test. The selection of questions for equating purposes is done with extreme precision involving professional judgments about both the content and the statistical properties of each question.
Through our customary quality-control procedures for scoring our standardized tests, we had early notice of the drop in the average scaled score—long before results were released to jurisdictions. Because we realized the implications of such a drop, we pursued a process of replicating and reconfirming the mathematical results by having several psychometricians work independently to re-equate the test. We also reexamined the decision-making process by which the equating items had been selected in the first place to confirm that there had been no changes that would have contributed to the change in the mean MBE score. It was essential that we undertake this for the sake of the test takers. They deserve a fair test competently scored. All of our efforts to date have confirmed the correctness of the scaled scores as calculated and reported.
I then looked to two areas for further corroboration. The first was internal to NCBE. Among the things I learned was that whereas the scores of those we know to be retaking the MBE dropped by 1.7 points, the score drop for those we believe to be first-time takers dropped by 2.7 points. (19% of July 2014 test takers were repeaters, and 65% were believed to be first-time takers. The remaining 16% could not be tracked because they tested in jurisdictions that collect inadequate data on the MBE answer sheets.) The decline for retakers was not atypical; however, the decline for first-time takers was without precedent during the previous 10 years.
Also telling is the fact that performance by all July 2014 takers on the equating items drawn from previous July test administrations was 1.63 percentage points lower than performance associated with the previous use of those items, as against a 0.57 percentage point increase in July 2013.
I also looked at what the results from the Multistate Professional Responsibility Examination (MPRE), separately administered three times each year, might tell me. The decline in MPRE performance supports what we saw in the July 2014 MBE numbers. In 2012, 66,499 candidates generated a mean score of 97.57 (on a 50–150 scale). In 2013, 62,674 candidates generated a mean score of 95.65. In 2014, a total of 60,546 candidates generated a mean score of 93.57. Because many MPRE test takers are still enrolled in law school when they test, these scores can be seen as presaging MBE performance in 2014 and 2015.
My second set of observations went beyond NCBE. I understand that the number of law schools reporting a median LSAT score below 150 for their entering classes has escalated over the past few years. To the extent that LSAT scores correlate with MBE scores, this cannot bode well for law schools with a median LSAT score below the 150 threshold.
Specifically, I looked at what happened to the overall mean LSAT score as reported by the Law School Admission Council for the first-year matriculants between 2010 (the class of 2013) and 2011 (the class of 2014). The reported mean dropped a modest amount for those completing the first year (from 157.7 to 157.4). What is unknown is the extent to which the effect of a change to reporting LSAT scores (from the average of all scores to the highest score earned) has offset what would otherwise have been a greater drop. (LSAC Research Reports indicate that roughly 30% of LSAT takers are repeaters and that this number has increased in recent years.)
For the future, and further complicating matters, effective with the fall 2012 entering class LSAC began reporting scores by whole numbers; therefore, the reported mean of 157 for fall 2012 (the class that will graduate in 2015) may represent anywhere from 156.5 to 157.4. For those matriculating in 2013 (the class of 2016), the LSAT mean lowered to a reported 156. Figures for the 2014 entering class are not available.
Beyond the national means lie the data that are specific to individual law schools, many of which have been struggling for several years with declining applications and shrinking enrollment figures. In some instances, law schools have been able to maintain their level of admission predictors—the undergraduate grade point average (UGPA) and the LSAT score. Some have reduced class sizes in order to accomplish this. To make judgments about changes in the cohort attending law school, it is useful to drill down to the 25th percentile of UGPA and LSAT scores for the years in question. There we see evidence of slippage at some schools, in some cases notwithstanding reductions in class size. And for matriculants below the 25th percentile, we know nothing; the tail of the curve leaves a lot of mystery, as the credentials of candidates so situated (presumably those last admitted) and the degree of change are unknown.
Another factor that bears consideration is the rising popularity of taking transfer students out of Law School A’s first-year class to bolster enrollment at Law School B, where Law School B is perceived by the transfer student to be the stronger of the two schools by reason of reputation. This mystic switch permits a law school to add to its enrollment without having to report the LSAT scores of the transferees, since the reported LSAT is a function of first-year matriculation, thus thwarting the all-important law school rankings. This process may weaken the overall quality of the student body of Law School B even as it weakens Law School A by poaching the cream of its crop. At the very least, it reduces the validity of comparisons of the mean LSAT scores and the mean MBE scores for Law Schools A and B because the cohort taking the bar exam from either school may be markedly different from the cohort of matriculants for whom an LSAT mean was calculated. Of course, this phenomenon does not account for the drop in the national MBE mean. It does, however, affect the statistics by which the performance of the two schools’ graduates is measured. (Note that the LSAT median, as reported in the rankings, is not the same thing as the LSAT mean.)
A brief list of other factors to consider could include the following:
- The rise of experiential learning—a laudable objective—has also ushered in the greater use at some schools of pass/fail grading that may mask the needs of students at risk. Without grades for feedback, students may not realize they are at risk. In addition, the rise of experiential learning may have crowded out time for students to take additional “black-letter” courses that would have strengthened their knowledge of the law and their synthesis of what they learned during the first year.
- There may be a trend in the direction of fewer required courses, or of fewer hours in a given required course, thereby permitting students to miss (or avoid) core subjects that will appear on the bar exam, or diminishing the amount of content coverage in a given course.
- Bar prep courses now offered within law schools are being outsourced to bar review companies, defeating a more reasonable relationship between such courses and sound, semester-long pedagogy with more deeply embedded understandings of the application of law.
- The decline in LSAT scores reported at the 25th percentile may have already called for increased attention to the need for academic support efforts that begin during the first year of law school, and this support may not have been delivered. Lack of academic support increases the chances that those in the bottom quartile of the class will struggle on the bar exam. In school after school, it is the law school grade-point average that is the most consistent predictor of bar passage success; therefore, close attention to those in the bottom ranks of the class is essential—and the earlier, the better—because they deserve the resources to put them on firmer footing as they move through law school and beyond.
Because it is an equated test, the MBE is a constant against which the performance of graduates can be gauged. It is a witness. It also serves as a sentinel. The July 2014 results communicated news with which law schools would rather not contend. So long as law school entrance predictors (the UGPA and the LSAT) continue to fall, and law schools do not adjust through pedagogy or by attrition, the news is not going to be encouraging.
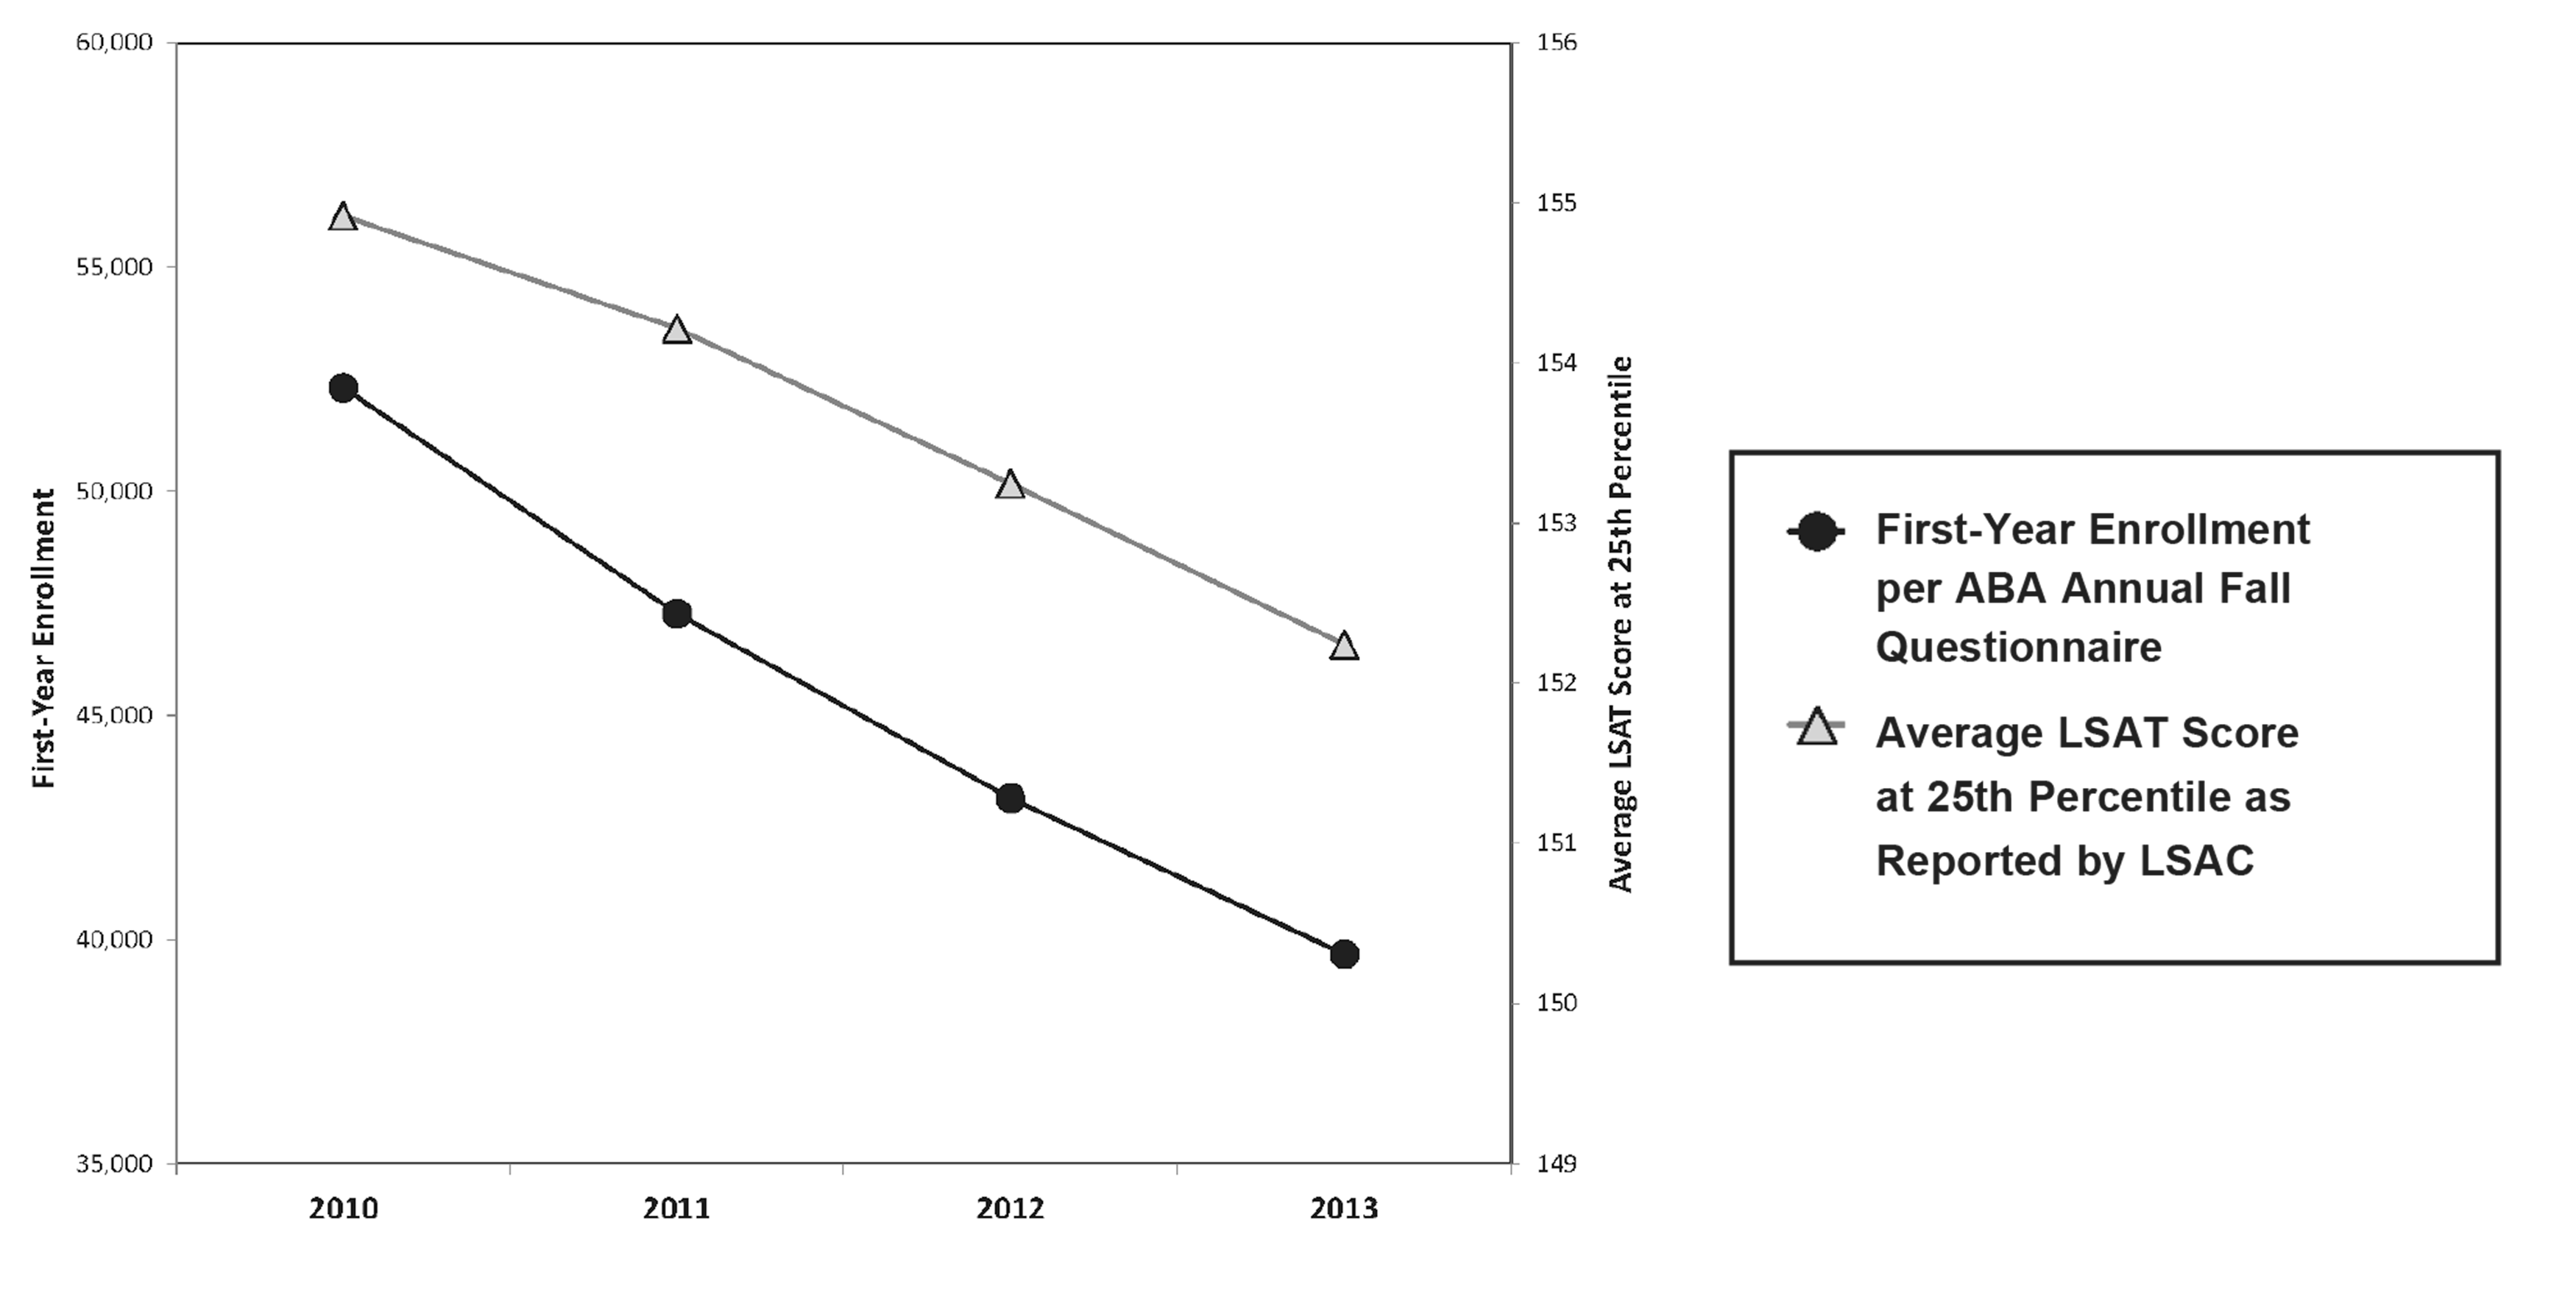
In the September 2013 issue of this magazine, I included a chart showing the change in the number of matriculants from 2010 to 2012 as provided by the American Bar Association’s Section of Legal Education and Admissions to the Bar. Because of the relationship between enrollment changes and bar passage, the chart, updated to show an additional year of data and reworked to show how enrollment and the LSAT 25th percentile may contribute to the downward trend at a given school, follows. 2014 data is not yet available.
Change in First-Year Enrollment from 2010 to 2013 and Reported Changes to the LSAT Score at the 25th Percentile
| ID | LAW SCHOOL | ENROLLMENT/LSAT | 2010 | 2011 | 2012 | 2013 | Change from 2010 to 2013 |
|---|---|---|---|---|---|---|---|
| 1 | AKRON, UNIVERSITY OF | FIRST-YEAR ENROLLMENT | 177 | 175 | 165 | 147 | -17% |
| 2 | ALABAMA, UNIVERSITY OF | FIRST-YEAR ENROLLMENT | 161 | 160 | 149 | 145 | -10% |
| 3 | ALBANY LAW SCHOOL OF UNION UNIVERSITY | FIRST-YEAR ENROLLMENT | 236 | 235 | 196 | 182 | -23% |
| 4 | AMERICAN UNIVERSITY | FIRST-YEAR ENROLLMENT | 502 | 475 | 491 | 473 | -6% |
| 5 | APPALACHIAN SCHOOL OF LAW | FIRST-YEAR ENROLLMENT | 127 | 146 | 75 | 56 | -56% |
| 6 | ARIZONA STATE UNIVERSITY | FIRST-YEAR ENROLLMENT | 191 | 168 | 151 | 128 | -33% |
| 7 | ARIZONA SUMMIT LAW SCHOOL | FIRST-YEAR ENROLLMENT | 392 | 450 | 447 | 310 | -21% |
| 8 | ARIZONA, UNIVERSITY OF | FIRST-YEAR ENROLLMENT | 157 | 137 | 109 | 105 | -33% |
| 9 | ARKANSAS, FAYETTEVILLE, UNIVERSITY OF | FIRST-YEAR ENROLLMENT | 138 | 136 | 133 | 112 | -19% |
| 10 | ARKANSAS, LITTLE ROCK, UNIVERSITY OF | FIRST-YEAR ENROLLMENT | 157 | 139 | 150 | 139 | -11% |
| 11 | ATLANTA'S JOHN MARSHALL LAW SCHOOL | FIRST-YEAR ENROLLMENT | 265 | 264 | 181 | 235 | -11% |
| 12 | AVE MARIA SCHOOL OF LAW | FIRST-YEAR ENROLLMENT | 203 | 151 | 113 | 117 | -42% |
| 13 | BALTIMORE, UNIVERSITY OF | FIRST-YEAR ENROLLMENT | 363 | 328 | 364 | 287 | -21% |
| 14 | BARRY UNIVERSITY | FIRST-YEAR ENROLLMENT | 254 | 267 | 293 | 283 | 11% |
| 15 | BAYLOR UNIVERSITY | FIRST-YEAR ENROLLMENT | 183 | 142 | 143 | 163 | -11% |
| 16 | BELMONT UNIVERSITY | FIRST-YEAR ENROLLMENT | 0 | 0 | 103 | 82 | — |
| 17 | BOSTON COLLEGE | FIRST-YEAR ENROLLMENT | 261 | 268 | 245 | 236 | -10% |
| 18 | BOSTON UNIVERSITY | FIRST-YEAR ENROLLMENT | 268 | 242 | 210 | 220 | -18% |
| 19 | BRIGHAM YOUNG UNIVERSITY | FIRST-YEAR ENROLLMENT | 150 | 145 | 140 | 139 | -7% |
| 20 | BROOKLYN LAW SCHOOL | FIRST-YEAR ENROLLMENT | 486 | 390 | 365 | 368 | -24% |
| 21 | BUFFALO-SUNY, UNIVERSITY OF | FIRST-YEAR ENROLLMENT | 219 | 175 | 203 | 198 | -10% |
| 22 | CALIFORNIA WESTERN SCHOOL OF LAW | FIRST-YEAR ENROLLMENT | 382 | 283 | 309 | 260 | -32% |
| 23 | CALIFORNIA-BERKELEY, UNIVERSITY OF | FIRST-YEAR ENROLLMENT | 286 | 254 | 263 | 284 | -1% |
| 24 | CALIFORNIA-DAVIS, UNIVERSITY OF | FIRST-YEAR ENROLLMENT | 196 | 192 | 189 | 142 | -28% |
| 25 | CALIFORNIA-HASTINGS, UNIVERSITY OF | FIRST-YEAR ENROLLMENT | 383 | 414 | 317 | 333 | -13% |
| 26 | CALIFORNIA-IRVINE, UNIVERSITY OF | FIRST-YEAR ENROLLMENT | 0 | 89 | 119 | 126 | — |
| 27 | CALIFORNIA-LOS ANGELES, UNIVERSITY OF | FIRST-YEAR ENROLLMENT | 308 | 319 | 304 | 293 | -5% |
| 28 | CAMPBELL UNIVERSITY | FIRST-YEAR ENROLLMENT | 162 | 191 | 160 | 125 | -23% |
| 29 | CAPITAL UNIVERSITY | FIRST-YEAR ENROLLMENT | 246 | 206 | 182 | 158 | -36% |
| 30 | CARDOZO SCHOOL OF LAW | FIRST-YEAR ENROLLMENT | 382 | 379 | 374 | 336 | -12% |
| 31 | CASE WESTERN RESERVE UNIVERSITY | FIRST-YEAR ENROLLMENT | 236 | 192 | 154 | 100 | -58% |
| 32 | CATHOLIC UNIVERSITY OF AMERICA | FIRST-YEAR ENROLLMENT | 274 | 232 | 141 | 161 | -41% |
| 33 | CHAPMAN UNIVERSITY | FIRST-YEAR ENROLLMENT | 212 | 160 | 166 | 157 | -26% |
| 34 | CHARLESTON SCHOOL OF LAW | FIRST-YEAR ENROLLMENT | 295 | 224 | 174 | 181 | -39% |
| 35 | CHARLOTTE SCHOOL OF LAW | FIRST-YEAR ENROLLMENT | 468 | 529 | 626 | 522 | 12% |
| 36 | CHICAGO, UNIVERSITY OF | FIRST-YEAR ENROLLMENT | 205 | 191 | 184 | 196 | -4% |
| 37 | CHICAGO-KENT COLLEGE OF LAW-IIT | FIRST-YEAR ENROLLMENT | 310 | 308 | 286 | 286 | -8% |
| 38 | CINCINNATI, UNIVERSITY OF | FIRST-YEAR ENROLLMENT | 144 | 119 | 103 | 100 | -31% |
| 39 | CITY UNIVERSITY OF NEW YORK | FIRST-YEAR ENROLLMENT | 163 | 171 | 120 | 104 | -36% |
| 40 | CLEVELAND STATE UNIVERSITY | FIRST-YEAR ENROLLMENT | 195 | 167 | 140 | 135 | -31% |
| 41 | COLORADO, UNIVERSITY OF | FIRST-YEAR ENROLLMENT | 180 | 163 | 152 | 184 | 2% |
| 42 | COLUMBIA UNIVERSITY | FIRST-YEAR ENROLLMENT | 404 | 406 | 366 | 352 | -13% |
| 43 | CONNECTICUT, UNIVERSITY OF | FIRST-YEAR ENROLLMENT | 186 | 181 | 150 | 151 | -19% |
| 44 | CORNELL UNIVERSITY | FIRST-YEAR ENROLLMENT | 205 | 204 | 191 | 193 | -6% |
| 45 | CREIGHTON UNIVERSITY | FIRST-YEAR ENROLLMENT | 144 | 135 | 130 | 138 | -4% |
| 46 | DAYTON, UNIVERSITY OF | FIRST-YEAR ENROLLMENT | 414 | 177 | 133 | 100 | -76% |
| 47 | DENVER, UNIVERSITY OF | FIRST-YEAR ENROLLMENT | 301 | 297 | 291 | 290 | -4% |
| 48 | DEPAUL UNIVERSITY | FIRST-YEAR ENROLLMENT | 312 | 298 | 273 | 276 | -12% |
| 49 | DETROIT MERCY, UNIVERSITY OF | FIRST-YEAR ENROLLMENT | 257 | 223 | 189 | 182 | -29% |
| 50 | DISTRICT OF COLUMBIA, UNIVERSITY OF THE | FIRST-YEAR ENROLLMENT | 131 | 131 | 125 | 99 | -24% |
| 51 | DRAKE UNIVERSITY | FIRST-YEAR ENROLLMENT | 155 | 142 | 128 | 115 | -26% |
| 52 | DREXEL UNIVERSITY | FIRST-YEAR ENROLLMENT | 146 | 147 | 140 | 143 | -2% |
| 53 | DUKE UNIVERSITY | FIRST-YEAR ENROLLMENT | 238 | 211 | 209 | 209 | -12% |
| 54 | DUQUESNE UNIVERSITY | FIRST-YEAR ENROLLMENT | 212 | 191 | 139 | 138 | -35% |
| 55 | ELON UNIVERSITY | FIRST-YEAR ENROLLMENT | 132 | 130 | 99 | 107 | -19% |
| 56 | EMORY UNIVERSITY | FIRST-YEAR ENROLLMENT | 293 | 246 | 253 | 231 | -21% |
| 57 | FAULKNER UNIVERSITY | FIRST-YEAR ENROLLMENT | 145 | 124 | 127 | 104 | -28% |
| 58 | FLORIDA A&M UNIVERSITY | FIRST-YEAR ENROLLMENT | 288 | 281 | 217 | 147 | -49% |
| 59 | FLORIDA COASTAL SCHOOL OF LAW | FIRST-YEAR ENROLLMENT | 808 | 671 | 580 | 441 | -45% |
| 60 | FLORIDA INTERNATIONAL UNIVERSITY | FIRST-YEAR ENROLLMENT | 161 | 151 | 155 | 158 | -2% |
| 61 | FLORIDA STATE UNIVERSITY | FIRST-YEAR ENROLLMENT | 199 | 200 | 187 | 170 | -15% |
| 62 | FLORIDA, UNIVERSITY OF | FIRST-YEAR ENROLLMENT | 310 | 295 | 284 | 314 | 1% |
| 63 | FORDHAM UNIVERSITY | FIRST-YEAR ENROLLMENT | 477 | 479 | 433 | 398 | -17% |
| 64 | GEORGE MASON UNIVERSITY | FIRST-YEAR ENROLLMENT | 303 | 186 | 147 | 149 | -51% |
| 65 | GEORGE WASHINGTON UNIVERSITY | FIRST-YEAR ENROLLMENT | 523 | 474 | 398 | 481 | -8% |
| 66 | GEORGETOWN UNIVERSITY | FIRST-YEAR ENROLLMENT | 591 | 579 | 575 | 544 | -8% |
| 67 | GEORGIA STATE UNIVERSITY | FIRST-YEAR ENROLLMENT | 224 | 223 | 191 | 181 | -19% |
| 68 | GEORGIA, UNIVERSITY OF | FIRST-YEAR ENROLLMENT | 248 | 225 | 188 | 199 | -20% |
| 69 | GOLDEN GATE UNIVERSITY | FIRST-YEAR ENROLLMENT | 320 | 229 | 227 | 150 | -53% |
| 70 | GONZAGA UNIVERSITY | FIRST-YEAR ENROLLMENT | 183 | 176 | 132 | 108 | -41% |
| 71 | HAMLINE UNIVERSITY | FIRST-YEAR ENROLLMENT | 227 | 205 | 124 | 88 | -61% |
| 72 | HARVARD UNIVERSITY | FIRST-YEAR ENROLLMENT | 561 | 559 | 555 | 568 | 1% |
| 73 | HAWAII, UNIVERSITY OF | FIRST-YEAR ENROLLMENT | 113 | 116 | 102 | 66 | -42% |
| 74 | HOFSTRA UNIVERSITY | FIRST-YEAR ENROLLMENT | 365 | 370 | 320 | 213 | -42% |
| 75 | HOUSTON, UNIVERSITY OF | FIRST-YEAR ENROLLMENT | 266 | 252 | 212 | 213 | -20% |
| 76 | HOWARD UNIVERSITY | FIRST-YEAR ENROLLMENT | 156 | 137 | 130 | 151 | -3% |
| 77 | IDAHO, UNIVERSITY OF | FIRST-YEAR ENROLLMENT | 130 | 130 | 102 | 111 | -15% |
| 78 | ILLINOIS, UNIVERSITY OF | FIRST-YEAR ENROLLMENT | 228 | 184 | 198 | 170 | -25% |
| 79 | INDIANA UNIVERSITY - BLOOMINGTON | FIRST-YEAR ENROLLMENT | 250 | 240 | 201 | 205 | -18% |
| 80 | INDIANA UNIVERSITY - INDIANAPOLIS | FIRST-YEAR ENROLLMENT | 282 | 314 | 259 | 227 | -20% |
| 81 | INTER AMERICAN UNIVERSITY OF PUERTO RICO | FIRST-YEAR ENROLLMENT | 869 | 246 | 129 | 212 | -76% |
| 82 | IOWA, UNIVERSITY OF | FIRST-YEAR ENROLLMENT | 203 | 180 | 155 | 93 | -54% |
| 83 | JOHN MARSHALL LAW SCHOOL | FIRST-YEAR ENROLLMENT | 539 | 512 | 498 | 404 | -25% |
| 84 | KANSAS, UNIVERSITY OF | FIRST-YEAR ENROLLMENT | 165 | 134 | 140 | 106 | -36% |
| 85 | KENTUCKY, UNIVERSITY OF | FIRST-YEAR ENROLLMENT | 135 | 130 | 136 | 149 | 10% |
| 86 | LA VERNE, UNIVERSITY OF | FIRST-YEAR ENROLLMENT | 166 | 55 | 44 | 50 | -70% |
| 87 | LEWIS AND CLARK COLLEGE | FIRST-YEAR ENROLLMENT | 247 | 226 | 214 | 172 | -30% |
| 88 | LIBERTY UNIVERSITY | FIRST-YEAR ENROLLMENT | 135 | 99 | 83 | 68 | -50% |
| 89 | LOUISIANA STATE UNIVERSITY | FIRST-YEAR ENROLLMENT | 222 | 236 | 199 | 178 | -20% |
| 90 | LOUISVILLE, UNIVERSITY OF | FIRST-YEAR ENROLLMENT | 143 | 132 | 140 | 129 | -10% |
| 91 | LOYOLA MARYMOUNT UNIVERSITY-LOS ANGELES | FIRST-YEAR ENROLLMENT | 403 | 391 | 376 | 358 | -11% |
| 92 | LOYOLA UNIVERSITY-CHICAGO | FIRST-YEAR ENROLLMENT | 292 | 274 | 287 | 213 | -27% |
| 93 | LOYOLA UNIVERSITY-NEW ORLEANS | FIRST-YEAR ENROLLMENT | 246 | 242 | 237 | 240 | -2% |
| 94 | MAINE, UNIVERSITY OF | FIRST-YEAR ENROLLMENT | 95 | 91 | 87 | 86 | -9% |
| 95 | MARQUETTE UNIVERSITY | FIRST-YEAR ENROLLMENT | 247 | 213 | 224 | 209 | -15% |
| 96 | MARYLAND, UNIVERSITY OF | FIRST-YEAR ENROLLMENT | 296 | 276 | 264 | 206 | -30% |
| 97 | MASSACHUSETTS-DARTMOUTH, UNIVERSITY OF | FIRST-YEAR ENROLLMENT | 0 | 0 | 71 | 78 | — |
| 98 | MCGEORGE SCHOOL OF LAW | FIRST-YEAR ENROLLMENT | 346 | 225 | 249 | 157 | -55% |
| 99 | MEMPHIS, UNIVERSITY OF | FIRST-YEAR ENROLLMENT | 158 | 144 | 112 | 111 | -30% |
| 100 | MERCER UNIVERSITY | FIRST-YEAR ENROLLMENT | 166 | 149 | 129 | 186 | 12% |
| 101 | MIAMI, UNIVERSITY OF | FIRST-YEAR ENROLLMENT | 489 | 447 | 426 | 308 | -37% |
| 102 | MICHIGAN STATE UNIVERSITY | FIRST-YEAR ENROLLMENT | 299 | 307 | 295 | 270 | -10% |
| 103 | MICHIGAN, UNIVERSITY OF | FIRST-YEAR ENROLLMENT | 376 | 359 | 344 | 315 | -16% |
| 104 | MINNESOTA, UNIVERSITY OF | FIRST-YEAR ENROLLMENT | 260 | 246 | 205 | 221 | -15% |
| 105 | MISSISSIPPI COLLEGE | FIRST-YEAR ENROLLMENT | 212 | 214 | 151 | 159 | -25% |
| 106 | MISSISSIPPI, UNIVERSITY OF | FIRST-YEAR ENROLLMENT | 199 | 180 | 157 | 117 | -41% |
| 107 | MISSOURI UNIVERSITY OF | FIRST-YEAR ENROLLMENT | 148 | 133 | 133 | 118 | -20% |
| 108 | MISSOURI-KANSAS CITY, UNIVERSITY OF | FIRST-YEAR ENROLLMENT | 156 | 149 | 153 | 172 | 10% |
| 109 | MONTANA, UNIVERSITY OF | FIRST-YEAR ENROLLMENT | 85 | 85 | 80 | 83 | -2% |
| 110 | NEBRASKA, UNIVERSITY OF | FIRST-YEAR ENROLLMENT | 145 | 128 | 134 | 127 | -12% |
| 111 | NEVADA - LAS VEGAS, UNIVERSITY OF | FIRST-YEAR ENROLLMENT | 145 | 140 | 139 | 113 | -22% |
| 112 | NEW ENGLAND SCHOOL OF LAW | FIRST-YEAR ENROLLMENT | 393 | 385 | 450 | 238 | -39% |
| 113 | NEW HAMPSHIRE, UNIVERSITY OF | FIRST-YEAR ENROLLMENT | 132 | 146 | 74 | 77 | -42% |
| 114 | NEW MEXICO, UNIVERSITY OF | FIRST-YEAR ENROLLMENT | 116 | 113 | 114 | 119 | 3% |
| 115 | NEW YORK LAW SCHOOL | FIRST-YEAR ENROLLMENT | 641 | 488 | 443 | 322 | -50% |
| 116 | NEW YORK UNIVERSITY | FIRST-YEAR ENROLLMENT | 476 | 450 | 451 | 437 | -8% |
| 117 | NORTH CAROLINA CENTRAL UNIVERSITY | FIRST-YEAR ENROLLMENT | 206 | 166 | 248 | 251 | 22% |
| 118 | NORTH CAROLINA, UNIVERSITY OF | FIRST-YEAR ENROLLMENT | 254 | 248 | 238 | 237 | -7% |
| 119 | NORTH DAKOTA, UNIVERSITY OF | FIRST-YEAR ENROLLMENT | 83 | 83 | 83 | 83 | 0% |
| 120 | NORTHEASTERN UNIVERSITY | FIRST-YEAR ENROLLMENT | 220 | 217 | 168 | 185 | -16% |
| 121 | NORTHERN ILLINOIS UNIVERSITY | FIRST-YEAR ENROLLMENT | 135 | 103 | 109 | 101 | -25% |
| 122 | NORTHERN KENTUCKY UNIVERSITY | FIRST-YEAR ENROLLMENT | 199 | 178 | 174 | 150 | -25% |
| 123 | NORTHWESTERN UNIVERSITY | FIRST-YEAR ENROLLMENT | 274 | 264 | 259 | 229 | -16% |
| 124 | NOTRE DAME, UNIVERSITY OF | FIRST-YEAR ENROLLMENT | 172 | 183 | 177 | 162 | -6% |
| 125 | NOVA SOUTHEASTERN UNIVERSITY | FIRST-YEAR ENROLLMENT | 386 | 354 | 369 | 305 | -21% |
| 126 | OHIO NORTHERN UNIVERSITY | FIRST-YEAR ENROLLMENT | 120 | 112 | 79 | 79 | -34% |
| 127 | OHIO STATE UNIVERSITY | FIRST-YEAR ENROLLMENT | 230 | 211 | 173 | 178 | -23% |
| 128 | OKLAHOMA CITY UNIVERSITY | FIRST-YEAR ENROLLMENT | 224 | 201 | 172 | 162 | -28% |
| 129 | OKLAHOMA, UNIVERSITY OF | FIRST-YEAR ENROLLMENT | 174 | 153 | 155 | 143 | -18% |
| 130 | OREGON, UNIVERSITY OF | FIRST-YEAR ENROLLMENT | 177 | 183 | 147 | 120 | -32% |
| 131 | PACE UNIVERSITY | FIRST-YEAR ENROLLMENT | 299 | 242 | 178 | 207 | -31% |
| 132 | PENN STATE UNIVERSITY | FIRST-YEAR ENROLLMENT | 228 | 185 | 162 | 132 | -42% |
| 133 | PENNSYLVANIA, UNIVERSITY OF | FIRST-YEAR ENROLLMENT | 250 | 266 | 243 | 251 | 0% |
| 134 | PEPPERDINE UNIVERSITY | FIRST-YEAR ENROLLMENT | 222 | 202 | 208 | 201 | -9% |
| 135 | PITTSBURGH, UNIVERSITY OF | FIRST-YEAR ENROLLMENT | 259 | 230 | 210 | 174 | -33% |
| 136 | PONTIFICAL CATHOLIC UNIVERSITY OF P.R. | FIRST-YEAR ENROLLMENT | 289 | 304 | 244 | 194 | -33% |
| 137 | PUERTO RICO, UNIVERSITY OF | FIRST-YEAR ENROLLMENT | 197 | 194 | 196 | 206 | 5% |
| 138 | QUINNIPIAC UNIVERSITY | FIRST-YEAR ENROLLMENT | 163 | 123 | 127 | 84 | -48% |
| 139 | REGENT UNIVERSITY | FIRST-YEAR ENROLLMENT | 168 | 154 | 142 | 106 | -37% |
| 140 | RICHMOND, UNIVERSITY OF | FIRST-YEAR ENROLLMENT | 146 | 154 | 153 | 133 | -9% |
| 141 | ROGER WILLIAMS UNIVERSITY | FIRST-YEAR ENROLLMENT | 198 | 194 | 151 | 111 | -44% |
| 142 | RUTGERS UNIVERSITY-CAMDEN | FIRST-YEAR ENROLLMENT | 269 | 282 | 116 | 140 | -48% |
| 143 | RUTGERS UNIVERSITY-NEWARK | FIRST-YEAR ENROLLMENT | 283 | 224 | 225 | 193 | -32% |
| 144 | SAINT LOUIS UNIVERSITY | FIRST-YEAR ENROLLMENT | 334 | 295 | 205 | 145 | -57% |
| 145 | SAMFORD UNIVERSITY | FIRST-YEAR ENROLLMENT | 166 | 152 | 121 | 173 | 4% |
| 146 | SAN DIEGO, UNIVERSITY OF | FIRST-YEAR ENROLLMENT | 330 | 300 | 246 | 241 | -27% |
| 147 | SAN FRANCISCO, UNIVERSITY OF | FIRST-YEAR ENROLLMENT | 281 | 246 | 220 | 159 | -43% |
| 148 | SANTA CLARA UNIVERSITY | FIRST-YEAR ENROLLMENT | 371 | 287 | 237 | 246 | -34% |
| 149 | SEATTLE UNIVERSITY | FIRST-YEAR ENROLLMENT | 324 | 322 | 284 | 228 | -30% |
| 150 | SETON HALL UNIVERSITY | FIRST-YEAR ENROLLMENT | 358 | 266 | 196 | 165 | -54% |
| 151 | SOUTH CAROLINA, UNIVERSITY OF | FIRST-YEAR ENROLLMENT | 239 | 213 | 213 | 206 | -14% |
| 152 | SOUTH DAKOTA, UNIVERSITY OF | FIRST-YEAR ENROLLMENT | 75 | 90 | 62 | 69 | -8% |
| 153 | SOUTH TEXAS COLLEGE OF LAW | FIRST-YEAR ENROLLMENT | 461 | 424 | 404 | 402 | -13% |
| 154 | SOUTHERN CALIFORNIA, UNIVERSITY OF | FIRST-YEAR ENROLLMENT | 220 | 199 | 188 | 175 | -20% |
| 155 | SOUTHERN ILLINOIS UNIVERSITY-CARBONDALE | FIRST-YEAR ENROLLMENT | 144 | 120 | 112 | 133 | -8% |
| 156 | SOUTHERN METHODIST UNIVERSITY | FIRST-YEAR ENROLLMENT | 254 | 232 | 218 | 212 | -17% |
| 157 | SOUTHERN UNIVERSITY | FIRST-YEAR ENROLLMENT | 320 | 258 | 268 | 224 | -30% |
| 158 | SOUTHWESTERN UNIVERSITY | FIRST-YEAR ENROLLMENT | 410 | 404 | 351 | 367 | -10% |
| 159 | ST. JOHN'S UNIVERSITY | FIRST-YEAR ENROLLMENT | 341 | 293 | 264 | 253 | -26% |
| 160 | ST. MARY'S UNIVERSITY | FIRST-YEAR ENROLLMENT | 301 | 255 | 248 | 311 | 3% |
| 161 | ST. THOMAS UNIVERSITY (FLORIDA) | FIRST-YEAR ENROLLMENT | 275 | 251 | 216 | 261 | -5% |
| 162 | ST. THOMAS, UNIVERSITY OF (MINNESOTA) | FIRST-YEAR ENROLLMENT | 168 | 171 | 143 | 114 | -32% |
| 163 | STANFORD UNIVERSITY | FIRST-YEAR ENROLLMENT | 180 | 180 | 180 | 179 | -1% |
| 164 | STETSON UNIVERSITY | FIRST-YEAR ENROLLMENT | 360 | 344 | 296 | 267 | -26% |
| 165 | SUFFOLK UNIVERSITY | FIRST-YEAR ENROLLMENT | 563 | 538 | 528 | 450 | -20% |
| 166 | SYRACUSE UNIVERSITY | FIRST-YEAR ENROLLMENT | 252 | 255 | 243 | 194 | -23% |
| 167 | TEMPLE UNIVERSITY | FIRST-YEAR ENROLLMENT | 326 | 270 | 253 | 225 | -31% |
| 168 | TENNESSEE, UNIVERSITY OF | FIRST-YEAR ENROLLMENT | 169 | 160 | 120 | 158 | -7% |
| 169 | TEXAS A & M UNIVERSITY | FIRST-YEAR ENROLLMENT | 253 | 236 | 258 | 244 | -4% |
| 170 | TEXAS AT AUSTIN, UNIVERSITY OF | FIRST-YEAR ENROLLMENT | 389 | 370 | 308 | 319 | -18% |
| 171 | TEXAS SOUTHERN UNIVERSITY | FIRST-YEAR ENROLLMENT | 212 | 219 | 185 | 196 | -8% |
| 172 | TEXAS TECH UNIVERSITY | FIRST-YEAR ENROLLMENT | 244 | 236 | 227 | 214 | -12% |
| 173 | THOMAS JEFFERSON SCHOOL OF LAW | FIRST-YEAR ENROLLMENT | 422 | 440 | 387 | 323 | -23% |
| 174 | THOMAS M. COOLEY LAW SCHOOL | FIRST-YEAR ENROLLMENT | 1,583 | 1,161 | 897 | 582 | -63% |
| 175 | TOLEDO, UNIVERSITY OF | FIRST-YEAR ENROLLMENT | 157 | 136 | 123 | 108 | -31% |
| 176 | TOURO COLLEGE | FIRST-YEAR ENROLLMENT | 280 | 260 | 242 | 205 | -27% |
| 177 | TULANE UNIVERSITY | FIRST-YEAR ENROLLMENT | 258 | 259 | 249 | 216 | -16% |
| 178 | TULSA, UNIVERSITY OF | FIRST-YEAR ENROLLMENT | 146 | 108 | 110 | 83 | -43% |
| 179 | UTAH, UNIVERSITY OF | FIRST-YEAR ENROLLMENT | 122 | 114 | 97 | 107 | -12% |
| 180 | VALPARAISO UNIVERSITY | FIRST-YEAR ENROLLMENT | 207 | 218 | 163 | 208 | 0% |
| 181 | VANDERBILT UNIVERSITY | FIRST-YEAR ENROLLMENT | 193 | 193 | 173 | 174 | -10% |
| 182 | VERMONT LAW SCHOOL | FIRST-YEAR ENROLLMENT | 212 | 151 | 171 | 129 | -39% |
| 183 | VILLANOVA UNIVERSITY | FIRST-YEAR ENROLLMENT | 251 | 218 | 220 | 162 | -35% |
| 184 | VIRGINIA, UNIVERSITY OF | FIRST-YEAR ENROLLMENT | 368 | 357 | 356 | 330 | -10% |
| 185 | WAKE FOREST UNIVERSITY | FIRST-YEAR ENROLLMENT | 165 | 185 | 125 | 179 | 8% |
| 186 | WASHBURN UNIVERSITY | FIRST-YEAR ENROLLMENT | 169 | 124 | 130 | 117 | -31% |
| 187 | WASHINGTON AND LEE UNIVERSITY | FIRST-YEAR ENROLLMENT | 144 | 121 | 187 | 111 | -23% |
| 188 | WASHINGTON UNIVERSITY | FIRST-YEAR ENROLLMENT | 276 | 243 | 201 | 189 | -32% |
| 189 | WASHINGTON, UNIVERSITY OF | FIRST-YEAR ENROLLMENT | 186 | 182 | 176 | 143 | -23% |
| 190 | WAYNE STATE UNIVERSITY | FIRST-YEAR ENROLLMENT | 197 | 181 | 148 | 139 | -29% |
| 191 | WEST VIRGINIA UNIVERSITY | FIRST-YEAR ENROLLMENT | 137 | 141 | 140 | 118 | -14% |
| 192 | WESTERN NEW ENGLAND UNIVERSITY | FIRST-YEAR ENROLLMENT | 168 | 106 | 108 | 120 | -29% |
| 193 | WESTERN STATE SCHOOL OF LAW | FIRST-YEAR ENROLLMENT | 242 | 237 | 144 | 120 | -50% |
| 194 | WHITTIER COLLEGE | FIRST-YEAR ENROLLMENT | 303 | 274 | 227 | 221 | -27% |
| 195 | WIDENER UNIVERSITY-DELAWARE | FIRST-YEAR ENROLLMENT | 389 | 313 | 221 | 239 | -39% |
| 196 | WIDENER UNIVERSITY-HARRISBURG | FIRST-YEAR ENROLLMENT | 178 | 155 | 106 | 74 | -58% |
| 197 | WILLAMETTE UNIVERSITY | FIRST-YEAR ENROLLMENT | 158 | 141 | 133 | 123 | -22% |
| 198 | WILLIAM AND MARY SCHOOL OF LAW | FIRST-YEAR ENROLLMENT | 217 | 217 | 196 | 226 | 4% |
| 199 | WILLIAM MITCHELL COLLEGE OF LAW | FIRST-YEAR ENROLLMENT | 357 | 309 | 258 | 236 | -34% |
| 200 | WISCONSIN, UNIVERSITY OF | FIRST-YEAR ENROLLMENT | 246 | 242 | 215 | 186 | -24% |
| 201 | WYOMING, UNIVERSITY OF | FIRST-YEAR ENROLLMENT | 82 | 69 | 77 | 71 | -13% |
| 202 | YALE UNIVERSITY | FIRST-YEAR ENROLLMENT | 205 | 205 | 203 | 199 | -3% |
| 203 | TOTAL FIRST-YEAR ENROLLMENT | TOTAL FIRST-YEAR ENROLLMENT | 52,313 | 47,276 | 43,155 | 39,674 | -24.16% |
| 204 | AKRON, UNIVERSITY OF | LSAT SCORE AT 25TH PERCENTILE | 152 | 151 | 151 | 150 | - |
| 205 | ALABAMA, UNIVERSITY OF | LSAT SCORE AT 25TH PERCENTILE | 159 | 158 | 158 | 157 | - |
| 206 | ALBANY LAW SCHOOL OF UNION UNIVERSITY | LSAT SCORE AT 25TH PERCENTILE | 152 | 151 | 149 | 150 | - |
| 207 | AMERICAN UNIVERSITY | LSAT SCORE AT 25TH PERCENTILE | 158 | 159 | 156 | 153 | - |
| 208 | APPALACHIAN SCHOOL OF LAW | LSAT SCORE AT 25TH PERCENTILE | 146 | 142 | 143 | 143 | - |
| 209 | ARIZONA STATE UNIVERSITY | LSAT SCORE AT 25TH PERCENTILE | 158 | 160 | 161 | 158 | - |
| 210 | ARIZONA SUMMIT LAW SCHOOL | LSAT SCORE AT 25TH PERCENTILE | 148 | 146 | 141 | 141 | - |
| 211 | ARIZONA, UNIVERSITY OF | LSAT SCORE AT 25TH PERCENTILE | 161 | 158 | 159 | 155 | - |
| 212 | ARKANSAS, FAYETTEVILLE, UNIVERSITY OF | LSAT SCORE AT 25TH PERCENTILE | 153 | 153 | 153 | 152 | - |
| 213 | ARKANSAS, LITTLE ROCK, UNIVERSITY OF | LSAT SCORE AT 25TH PERCENTILE | 151 | 151 | 149 | 147 | - |
| 214 | ATLANTA'S JOHN MARSHALL LAW SCHOOL | LSAT SCORE AT 25TH PERCENTILE | 148 | 148 | 148 | 146 | - |
| 215 | AVE MARIA SCHOOL OF LAW | LSAT SCORE AT 25TH PERCENTILE | 147 | 146 | 144 | 141 | - |
| 216 | BALTIMORE, UNIVERSITY OF | LSAT SCORE AT 25TH PERCENTILE | 151 | 151 | 149 | 150 | - |
| 217 | BARRY UNIVERSITY | LSAT SCORE AT 25TH PERCENTILE | 149 | 147 | 145 | 145 | - |
| 218 | BAYLOR UNIVERSITY | LSAT SCORE AT 25TH PERCENTILE | 162 | 159 | 158 | 156 | - |
| 219 | BELMONT UNIVERSITY | LSAT SCORE AT 25TH PERCENTILE | 0 | 0 | 0 | 152 | - |
| 220 | BOSTON COLLEGE | LSAT SCORE AT 25TH PERCENTILE | 163 | 162 | 161 | 160 | - |
| 221 | BOSTON UNIVERSITY | LSAT SCORE AT 25TH PERCENTILE | 164 | 163 | 162 | 161 | - |
| 222 | BRIGHAM YOUNG UNIVERSITY | LSAT SCORE AT 25TH PERCENTILE | 161 | 160 | 158 | 158 | - |
| 223 | BROOKLYN LAW SCHOOL | LSAT SCORE AT 25TH PERCENTILE | 162 | 160 | 158 | 157 | - |
| 224 | BUFFALO-SUNY, UNIVERSITY OF | LSAT SCORE AT 25TH PERCENTILE | 155 | 154 | 152 | 150 | - |
| 225 | CALIFORNIA WESTERN SCHOOL OF LAW | LSAT SCORE AT 25TH PERCENTILE | 151 | 150 | 148 | 148 | - |
| 226 | CALIFORNIA-BERKELEY, UNIVERSITY OF | LSAT SCORE AT 25TH PERCENTILE | 162 | 164 | 163 | 163 | - |
| 227 | CALIFORNIA-DAVIS, UNIVERSITY OF | LSAT SCORE AT 25TH PERCENTILE | 160 | 161 | 160 | 159 | - |
| 228 | CALIFORNIA-HASTINGS, UNIVERSITY OF | LSAT SCORE AT 25TH PERCENTILE | 160 | 157 | 157 | 155 | - |
| 229 | CALIFORNIA-IRVINE, UNIVERSITY OF | LSAT SCORE AT 25TH PERCENTILE | 0 | 163 | 162 | 162 | - |
| 230 | CALIFORNIA-LOS ANGELES, UNIVERSITY OF | LSAT SCORE AT 25TH PERCENTILE | 165 | 164 | 164 | 162 | - |
| 231 | CAMPBELL UNIVERSITY | LSAT SCORE AT 25TH PERCENTILE | 154 | 153 | 152 | 151 | - |
| 232 | CAPITAL UNIVERSITY | LSAT SCORE AT 25TH PERCENTILE | 150 | 148 | 147 | 145 | - |
| 233 | CARDOZO SCHOOL OF LAW | LSAT SCORE AT 25TH PERCENTILE | 160 | 158 | 158 | 156 | - |
| 234 | CASE WESTERN RESERVE UNIVERSITY | LSAT SCORE AT 25TH PERCENTILE | 157 | 153 | 156 | 155 | - |
| 235 | CATHOLIC UNIVERSITY OF AMERICA | LSAT SCORE AT 25TH PERCENTILE | 156 | 151 | 153 | 151 | - |
| 236 | CHAPMAN UNIVERSITY | LSAT SCORE AT 25TH PERCENTILE | 155 | 154 | 154 | 155 | - |
| 237 | CHARLESTON SCHOOL OF LAW | LSAT SCORE AT 25TH PERCENTILE | 151 | 148 | 149 | 146 | - |
| 238 | CHARLOTTE SCHOOL OF LAW | LSAT SCORE AT 25TH PERCENTILE | 148 | 145 | 142 | 141 | - |
| 239 | CHICAGO, UNIVERSITY OF | LSAT SCORE AT 25TH PERCENTILE | 168 | 167 | 167 | 166 | - |
| 240 | CHICAGO-KENT COLLEGE OF LAW-IIT | LSAT SCORE AT 25TH PERCENTILE | 155 | 155 | 154 | 153 | - |
| 241 | CINCINNATI, UNIVERSITY OF | LSAT SCORE AT 25TH PERCENTILE | 157 | 155 | 156 | 155 | - |
| 242 | CITY UNIVERSITY OF NEW YORK | LSAT SCORE AT 25TH PERCENTILE | 152 | 153 | 154 | 153 | - |
| 243 | CLEVELAND STATE UNIVERSITY | LSAT SCORE AT 25TH PERCENTILE | 153 | 152 | 151 | 150 | - |
| 244 | COLORADO, UNIVERSITY OF | LSAT SCORE AT 25TH PERCENTILE | 161 | 158 | 159 | 158 | - |
| 245 | COLUMBIA UNIVERSITY | LSAT SCORE AT 25TH PERCENTILE | 170 | 170 | 170 | 169 | - |
| 246 | CONNECTICUT, UNIVERSITY OF | LSAT SCORE AT 25TH PERCENTILE | 158 | 157 | 157 | 154 | - |
| 247 | CORNELL UNIVERSITY | LSAT SCORE AT 25TH PERCENTILE | 166 | 166 | 166 | 165 | - |
| 248 | CREIGHTON UNIVERSITY | LSAT SCORE AT 25TH PERCENTILE | 151 | 150 | 150 | 149 | - |
| 249 | DAYTON, UNIVERSITY OF | LSAT SCORE AT 25TH PERCENTILE | 150 | 148 | 146 | 145 | - |
| 250 | DENVER, UNIVERSITY OF | LSAT SCORE AT 25TH PERCENTILE | 156 | 155 | 155 | 154 | - |
| 251 | DEPAUL UNIVERSITY | LSAT SCORE AT 25TH PERCENTILE | 156 | 154 | 153 | 151 | - |
| 252 | DETROIT MERCY, UNIVERSITY OF | LSAT SCORE AT 25TH PERCENTILE | 146 | 147 | 146 | 147 | - |
| 253 | DISTRICT OF COLUMBIA, UNIVERSITY OF THE | LSAT SCORE AT 25TH PERCENTILE | 149 | 151 | 148 | 147 | - |
| 254 | DRAKE UNIVERSITY | LSAT SCORE AT 25TH PERCENTILE | 153 | 153 | 152 | 149 | - |
| 255 | DREXEL UNIVERSITY | LSAT SCORE AT 25TH PERCENTILE | 156 | 157 | 154 | 152 | - |
| 256 | DUKE UNIVERSITY | LSAT SCORE AT 25TH PERCENTILE | 168 | 167 | 166 | 165 | - |
| 257 | DUQUESNE UNIVERSITY | LSAT SCORE AT 25TH PERCENTILE | 151 | 151 | 150 | 150 | - |
| 258 | ELON UNIVERSITY | LSAT SCORE AT 25TH PERCENTILE | 153 | 150 | 150 | 146 | - |
| 259 | EMORY UNIVERSITY | LSAT SCORE AT 25TH PERCENTILE | 166 | 159 | 161 | 157 | - |
| 260 | FAULKNER UNIVERSITY | LSAT SCORE AT 25TH PERCENTILE | 148 | 146 | 145 | 142 | - |
| 261 | FLORIDA A&M UNIVERSITY | LSAT SCORE AT 25TH PERCENTILE | 144 | 145 | 144 | 144 | - |
| 262 | FLORIDA COASTAL SCHOOL OF LAW | LSAT SCORE AT 25TH PERCENTILE | 146 | 145 | 143 | 141 | - |
| 263 | FLORIDA INTERNATIONAL UNIVERSITY | LSAT SCORE AT 25TH PERCENTILE | 152 | 152 | 151 | 151 | - |
| 264 | FLORIDA STATE UNIVERSITY | LSAT SCORE AT 25TH PERCENTILE | 161 | 160 | 157 | 157 | - |
| 265 | FLORIDA, UNIVERSITY OF | LSAT SCORE AT 25TH PERCENTILE | 160 | 160 | 160 | 156 | - |
| 266 | FORDHAM UNIVERSITY | LSAT SCORE AT 25TH PERCENTILE | 163 | 163 | 162 | 161 | - |
| 267 | GEORGE MASON UNIVERSITY | LSAT SCORE AT 25TH PERCENTILE | 158 | 157 | 158 | 157 | - |
| 268 | GEORGE WASHINGTON UNIVERSITY | LSAT SCORE AT 25TH PERCENTILE | 162 | 161 | 161 | 159 | - |
| 269 | GEORGETOWN UNIVERSITY | LSAT SCORE AT 25TH PERCENTILE | 168 | 167 | 165 | 163 | - |
| 270 | GEORGIA STATE UNIVERSITY | LSAT SCORE AT 25TH PERCENTILE | 159 | 158 | 156 | 157 | - |
| 271 | GEORGIA, UNIVERSITY OF | LSAT SCORE AT 25TH PERCENTILE | 162 | 162 | 158 | 158 | - |
| 272 | GOLDEN GATE UNIVERSITY | LSAT SCORE AT 25TH PERCENTILE | 151 | 150 | 148 | 147 | - |
| 273 | GONZAGA UNIVERSITY | LSAT SCORE AT 25TH PERCENTILE | 154 | 153 | 152 | 152 | - |
| 274 | HAMLINE UNIVERSITY | LSAT SCORE AT 25TH PERCENTILE | 149 | 148 | 148 | 149 | - |
| 275 | HARVARD UNIVERSITY | LSAT SCORE AT 25TH PERCENTILE | 171 | 171 | 170 | 170 | - |
| 276 | HAWAII, UNIVERSITY OF | LSAT SCORE AT 25TH PERCENTILE | 153 | 153 | 154 | 155 | - |
| 277 | HOFSTRA UNIVERSITY | LSAT SCORE AT 25TH PERCENTILE | 156 | 155 | 153 | 151 | - |
| 278 | HOUSTON, UNIVERSITY OF | LSAT SCORE AT 25TH PERCENTILE | 159 | 157 | 159 | 157 | - |
| 279 | HOWARD UNIVERSITY | LSAT SCORE AT 25TH PERCENTILE | 151 | 150 | 150 | 148 | - |
| 280 | IDAHO, UNIVERSITY OF | LSAT SCORE AT 25TH PERCENTILE | 151 | 149 | 149 | 148 | - |
| 281 | ILLINOIS, UNIVERSITY OF | LSAT SCORE AT 25TH PERCENTILE | 163 | 156 | 158 | 157 | - |
| 282 | INDIANA UNIVERSITY - BLOOMINGTON | LSAT SCORE AT 25TH PERCENTILE | 156 | 158 | 156 | 154 | - |
| 283 | INDIANA UNIVERSITY - INDIANAPOLIS | LSAT SCORE AT 25TH PERCENTILE | 151 | 152 | 149 | 150 | - |
| 284 | INTER AMERICAN UNIVERSITY OF PUERTO RICO | LSAT SCORE AT 25TH PERCENTILE | 135 | 135 | 135 | 135 | - |
| 285 | IOWA, UNIVERSITY OF | LSAT SCORE AT 25TH PERCENTILE | 158 | 158 | 158 | 158 | - |
| 286 | JOHN MARSHALL LAW SCHOOL | LSAT SCORE AT 25TH PERCENTILE | 151 | 149 | 148 | 146 | - |
| 287 | KANSAS, UNIVERSITY OF | LSAT SCORE AT 25TH PERCENTILE | 155 | 154 | 154 | 153 | - |
| 288 | KENTUCKY, UNIVERSITY OF | LSAT SCORE AT 25TH PERCENTILE | 157 | 155 | 155 | 154 | - |
| 289 | LA VERNE, UNIVERSITY OF | LSAT SCORE AT 25TH PERCENTILE | 150 | 150 | 147 | 146 | - |
| 290 | LEWIS AND CLARK COLLEGE | LSAT SCORE AT 25TH PERCENTILE | 157 | 157 | 156 | 154 | - |
| 291 | LIBERTY UNIVERSITY | LSAT SCORE AT 25TH PERCENTILE | 148 | 148 | 148 | 148 | - |
| 292 | LOUISIANA STATE UNIVERSITY | LSAT SCORE AT 25TH PERCENTILE | 155 | 155 | 153 | 153 | - |
| 293 | LOUISVILLE, UNIVERSITY OF | LSAT SCORE AT 25TH PERCENTILE | 155 | 152 | 155 | 152 | - |
| 294 | LOYOLA MARYMOUNT UNIVERSITY-LOS ANGELES | LSAT SCORE AT 25TH PERCENTILE | 158 | 158 | 157 | 156 | - |
| 295 | LOYOLA UNIVERSITY-CHICAGO | LSAT SCORE AT 25TH PERCENTILE | 157 | 156 | 156 | 155 | - |
| 296 | LOYOLA UNIVERSITY-NEW ORLEANS | LSAT SCORE AT 25TH PERCENTILE | 150 | 151 | 150 | 147 | - |
| 297 | MAINE, UNIVERSITY OF | LSAT SCORE AT 25TH PERCENTILE | 153 | 153 | 152 | 152 | - |
| 298 | MARQUETTE UNIVERSITY | LSAT SCORE AT 25TH PERCENTILE | 154 | 154 | 153 | 151 | - |
| 299 | MARYLAND, UNIVERSITY OF | LSAT SCORE AT 25TH PERCENTILE | 157 | 156 | 151 | 154 | - |
| 300 | MASSACHUSETTS-DARTMOUTH, UNIVERSITY OF | LSAT SCORE AT 25TH PERCENTILE | 0 | 142 | 143 | 145 | - |
| 301 | MCGEORGE SCHOOL OF LAW | LSAT SCORE AT 25TH PERCENTILE | 155 | 155 | 152 | 151 | - |
| 302 | MEMPHIS, UNIVERSITY OF | LSAT SCORE AT 25TH PERCENTILE | 153 | 153 | 152 | 151 | - |
| 303 | MERCER UNIVERSITY | LSAT SCORE AT 25TH PERCENTILE | 153 | 151 | 149 | 148 | - |
| 304 | MIAMI, UNIVERSITY OF | LSAT SCORE AT 25TH PERCENTILE | 156 | 156 | 155 | 155 | - |
| 305 | MICHIGAN STATE UNIVERSITY | LSAT SCORE AT 25TH PERCENTILE | 152 | 152 | 152 | 152 | - |
| 306 | MICHIGAN, UNIVERSITY OF | LSAT SCORE AT 25TH PERCENTILE | 168 | 167 | 166 | 165 | - |
| 307 | MINNESOTA, UNIVERSITY OF | LSAT SCORE AT 25TH PERCENTILE | 159 | 157 | 158 | 156 | - |
| 308 | MISSISSIPPI COLLEGE | LSAT SCORE AT 25TH PERCENTILE | 147 | 147 | 146 | 145 | - |
| 309 | MISSISSIPPI, UNIVERSITY OF | LSAT SCORE AT 25TH PERCENTILE | 151 | 151 | 151 | 152 | - |
| 310 | MISSOURI UNIVERSITY OF | LSAT SCORE AT 25TH PERCENTILE | 157 | 156 | 152 | 155 | - |
| 311 | MISSOURI-KANSAS CITY, UNIVERSITY OF | LSAT SCORE AT 25TH PERCENTILE | 154 | 153 | 149 | 150 | - |
| 312 | MONTANA, UNIVERSITY OF | LSAT SCORE AT 25TH PERCENTILE | 153 | 152 | 152 | 151 | - |
| 313 | NEBRASKA, UNIVERSITY OF | LSAT SCORE AT 25TH PERCENTILE | 153 | 153 | 155 | 152 | - |
| 314 | NEVADA - LAS VEGAS, UNIVERSITY OF | LSAT SCORE AT 25TH PERCENTILE | 156 | 157 | 156 | 154 | - |
| 315 | NEW ENGLAND SCHOOL OF LAW | LSAT SCORE AT 25TH PERCENTILE | 151 | 149 | 145 | 145 | - |
| 316 | NEW HAMPSHIRE, UNIVERSITY OF | LSAT SCORE AT 25TH PERCENTILE | 150 | 151 | 151 | 153 | - |
| 317 | NEW MEXICO, UNIVERSITY OF | LSAT SCORE AT 25TH PERCENTILE | 153 | 152 | 152 | 151 | - |
| 318 | NEW YORK LAW SCHOOL | LSAT SCORE AT 25TH PERCENTILE | 153 | 151 | 149 | 149 | - |
| 319 | NEW YORK UNIVERSITY | LSAT SCORE AT 25TH PERCENTILE | 169 | 170 | 169 | 168 | - |
| 320 | NORTH CAROLINA CENTRAL UNIVERSITY | LSAT SCORE AT 25TH PERCENTILE | 143 | 145 | 143 | 142 | - |
| 321 | NORTH CAROLINA, UNIVERSITY OF | LSAT SCORE AT 25TH PERCENTILE | 159 | 161 | 160 | 159 | - |
| 322 | NORTH DAKOTA, UNIVERSITY OF | LSAT SCORE AT 25TH PERCENTILE | 148 | 148 | 145 | 145 | - |
| 323 | NORTHEASTERN UNIVERSITY | LSAT SCORE AT 25TH PERCENTILE | 155 | 154 | 154 | 153 | - |
| 324 | NORTHERN ILLINOIS UNIVERSITY | LSAT SCORE AT 25TH PERCENTILE | 150 | 150 | 147 | 146 | - |
| 325 | NORTHERN KENTUCKY UNIVERSITY | LSAT SCORE AT 25TH PERCENTILE | 152 | 151 | 149 | 149 | - |
| 326 | NORTHWESTERN UNIVERSITY | LSAT SCORE AT 25TH PERCENTILE | 166 | 165 | 164 | 161 | - |
| 327 | NOTRE DAME, UNIVERSITY OF | LSAT SCORE AT 25TH PERCENTILE | 162 | 162 | 161 | 160 | - |
| 328 | NOVA SOUTHEASTERN UNIVERSITY | LSAT SCORE AT 25TH PERCENTILE | 148 | 148 | 147 | 146 | - |
| 329 | OHIO NORTHERN UNIVERSITY | LSAT SCORE AT 25TH PERCENTILE | 149 | 149 | 145 | 145 | - |
| 330 | OHIO STATE UNIVERSITY | LSAT SCORE AT 25TH PERCENTILE | 160 | 159 | 158 | 157 | - |
| 331 | OKLAHOMA CITY UNIVERSITY | LSAT SCORE AT 25TH PERCENTILE | 149 | 149 | 147 | 145 | - |
| 332 | OKLAHOMA, UNIVERSITY OF | LSAT SCORE AT 25TH PERCENTILE | 157 | 155 | 155 | 155 | - |
| 333 | OREGON, UNIVERSITY OF | LSAT SCORE AT 25TH PERCENTILE | 157 | 157 | 155 | 156 | - |
| 334 | PACE UNIVERSITY | LSAT SCORE AT 25TH PERCENTILE | 152 | 151 | 150 | 147 | - |
| 335 | PENN STATE UNIVERSITY | LSAT SCORE AT 25TH PERCENTILE | 157 | 156 | 156 | 154 | - |
| 336 | PENNSYLVANIA, UNIVERSITY OF | LSAT SCORE AT 25TH PERCENTILE | 166 | 166 | 164 | 165 | - |
| 337 | PEPPERDINE UNIVERSITY | LSAT SCORE AT 25TH PERCENTILE | 159 | 158 | 156 | 154 | - |
| 338 | PITTSBURGH, UNIVERSITY OF | LSAT SCORE AT 25TH PERCENTILE | 158 | 157 | 155 | 154 | - |
| 339 | PONTIFICAL CATHOLIC UNIVERSITY OF P.R. | LSAT SCORE AT 25TH PERCENTILE | 132 | 132 | 132 | 132 | - |
| 340 | PUERTO RICO, UNIVERSITY OF | LSAT SCORE AT 25TH PERCENTILE | 142 | 143 | 140 | 142 | - |
| 341 | QUINNIPIAC UNIVERSITY | LSAT SCORE AT 25TH PERCENTILE | 154 | 154 | 153 | 151 | - |
| 342 | REGENT UNIVERSITY | LSAT SCORE AT 25TH PERCENTILE | 150 | 150 | 151 | 150 | - |
| 343 | RICHMOND, UNIVERSITY OF | LSAT SCORE AT 25TH PERCENTILE | 159 | 158 | 158 | 157 | - |
| 344 | ROGER WILLIAMS UNIVERSITY | LSAT SCORE AT 25TH PERCENTILE | 149 | 149 | 147 | 146 | - |
| 345 | RUTGERS UNIVERSITY-CAMDEN | LSAT SCORE AT 25TH PERCENTILE | 157 | 156 | 153 | 154 | - |
| 346 | RUTGERS UNIVERSITY-NEWARK | LSAT SCORE AT 25TH PERCENTILE | 155 | 155 | 155 | 154 | - |
| 347 | SAINT LOUIS UNIVERSITY | LSAT SCORE AT 25TH PERCENTILE | 153 | 151 | 151 | 151 | - |
| 348 | SAMFORD UNIVERSITY | LSAT SCORE AT 25TH PERCENTILE | 153 | 152 | 151 | 148 | - |
| 349 | SAN DIEGO, UNIVERSITY OF | LSAT SCORE AT 25TH PERCENTILE | 159 | 158 | 157 | 156 | - |
| 350 | SAN FRANCISCO, UNIVERSITY OF | LSAT SCORE AT 25TH PERCENTILE | 155 | 155 | 153 | 151 | - |
| 351 | SANTA CLARA UNIVERSITY | LSAT SCORE AT 25TH PERCENTILE | 158 | 157 | 156 | 155 | - |
| 352 | SEATTLE UNIVERSITY | LSAT SCORE AT 25TH PERCENTILE | 155 | 154 | 154 | 153 | - |
| 353 | SETON HALL UNIVERSITY | LSAT SCORE AT 25TH PERCENTILE | 155 | 155 | 154 | 152 | - |
| 354 | SOUTH CAROLINA, UNIVERSITY OF | LSAT SCORE AT 25TH PERCENTILE | 156 | 155 | 154 | 153 | - |
| 355 | SOUTH DAKOTA, UNIVERSITY OF | LSAT SCORE AT 25TH PERCENTILE | 149 | 152 | 146 | 144 | - |
| 356 | SOUTH TEXAS COLLEGE OF LAW | LSAT SCORE AT 25TH PERCENTILE | 151 | 152 | 151 | 148 | - |
| 357 | SOUTHERN CALIFORNIA, UNIVERSITY OF | LSAT SCORE AT 25TH PERCENTILE | 166 | 165 | 165 | 163 | - |
| 358 | SOUTHERN ILLINOIS UNIVERSITY-CARBONDALE | LSAT SCORE AT 25TH PERCENTILE | 151 | 151 | 149 | 147 | - |
| 359 | SOUTHERN METHODIST UNIVERSITY | LSAT SCORE AT 25TH PERCENTILE | 156 | 157 | 157 | 157 | - |
| 360 | SOUTHERN UNIVERSITY | LSAT SCORE AT 25TH PERCENTILE | 143 | 142 | 143 | 142 | - |
| 361 | SOUTHWESTERN UNIVERSITY | LSAT SCORE AT 25TH PERCENTILE | 152 | 152 | 151 | 150 | - |
| 362 | ST. JOHN'S UNIVERSITY | LSAT SCORE AT 25TH PERCENTILE | 156 | 154 | 153 | 153 | - |
| 363 | ST. MARY'S UNIVERSITY | LSAT SCORE AT 25TH PERCENTILE | 151 | 151 | 151 | 148 | - |
| 364 | ST. THOMAS UNIVERSITY (FLORIDA) | LSAT SCORE AT 25TH PERCENTILE | 148 | 148 | 146 | 145 | - |
| 365 | ST. THOMAS, UNIVERSITY OF (MINNESOTA) | LSAT SCORE AT 25TH PERCENTILE | 154 | 153 | 152 | 150 | - |
| 366 | STANFORD UNIVERSITY | LSAT SCORE AT 25TH PERCENTILE | 167 | 167 | 168 | 169 | - |
| 367 | STETSON UNIVERSITY | LSAT SCORE AT 25TH PERCENTILE | 154 | 153 | 152 | 152 | - |
| 368 | SUFFOLK UNIVERSITY | LSAT SCORE AT 25TH PERCENTILE | 152 | 151 | 147 | 145 | - |
| 369 | SYRACUSE UNIVERSITY | LSAT SCORE AT 25TH PERCENTILE | 153 | 153 | 152 | 152 | - |
| 370 | TEMPLE UNIVERSITY | LSAT SCORE AT 25TH PERCENTILE | 159 | 158 | 158 | 156 | - |
| 371 | TENNESSEE, UNIVERSITY OF | LSAT SCORE AT 25TH PERCENTILE | 156 | 156 | 156 | 153 | - |
| 372 | TEXAS A & M UNIVERSITY | LSAT SCORE AT 25TH PERCENTILE | 151 | 151 | 149 | 150 | - |
| 373 | TEXAS AT AUSTIN, UNIVERSITY OF | LSAT SCORE AT 25TH PERCENTILE | 164 | 165 | 163 | 163 | - |
| 374 | TEXAS SOUTHERN UNIVERSITY | LSAT SCORE AT 25TH PERCENTILE | 145 | 144 | 143 | 141 | - |
| 375 | TEXAS TECH UNIVERSITY | LSAT SCORE AT 25TH PERCENTILE | 153 | 152 | 152 | 152 | - |
| 376 | THOMAS JEFFERSON SCHOOL OF LAW | LSAT SCORE AT 25TH PERCENTILE | 149 | 148 | 146 | 144 | - |
| 377 | THOMAS M. COOLEY LAW SCHOOL | LSAT SCORE AT 25TH PERCENTILE | 144 | 143 | 142 | 141 | - |
| 378 | TOLEDO, UNIVERSITY OF | LSAT SCORE AT 25TH PERCENTILE | 150 | 150 | 149 | 148 | - |
| 379 | TOURO COLLEGE | LSAT SCORE AT 25TH PERCENTILE | 149 | 148 | 146 | 145 | - |
| 380 | TULANE UNIVERSITY | LSAT SCORE AT 25TH PERCENTILE | 160 | 158 | 156 | 156 | - |
| 381 | TULSA, UNIVERSITY OF | LSAT SCORE AT 25TH PERCENTILE | 152 | 152 | 153 | 152 | - |
| 382 | UTAH, UNIVERSITY OF | LSAT SCORE AT 25TH PERCENTILE | 157 | 157 | 156 | 155 | - |
| 383 | VALPARAISO UNIVERSITY | LSAT SCORE AT 25TH PERCENTILE | 147 | 147 | 145 | 141 | - |
| 384 | VANDERBILT UNIVERSITY | LSAT SCORE AT 25TH PERCENTILE | 165 | 165 | 163 | 163 | - |
| 385 | VERMONT LAW SCHOOL | LSAT SCORE AT 25TH PERCENTILE | 153 | 151 | 149 | 147 | - |
| 386 | VILLANOVA UNIVERSITY | LSAT SCORE AT 25TH PERCENTILE | 159 | 157 | 155 | 153 | - |
| 387 | VIRGINIA, UNIVERSITY OF | LSAT SCORE AT 25TH PERCENTILE | 166 | 165 | 164 | 164 | - |
| 388 | WAKE FOREST UNIVERSITY | LSAT SCORE AT 25TH PERCENTILE | 160 | 160 | 159 | 157 | - |
| 389 | WASHBURN UNIVERSITY | LSAT SCORE AT 25TH PERCENTILE | 153 | 152 | 150 | 149 | - |
| 390 | WASHINGTON AND LEE UNIVERSITY | LSAT SCORE AT 25TH PERCENTILE | 161 | 159 | 159 | 160 | - |
| 391 | WASHINGTON UNIVERSITY | LSAT SCORE AT 25TH PERCENTILE | 162 | 162 | 160 | 160 | - |
| 392 | WASHINGTON, UNIVERSITY OF | LSAT SCORE AT 25TH PERCENTILE | 160 | 161 | 162 | 161 | - |
| 393 | WAYNE STATE UNIVERSITY | LSAT SCORE AT 25TH PERCENTILE | 153 | 155 | 153 | 153 | - |
| 394 | WEST VIRGINIA UNIVERSITY | LSAT SCORE AT 25TH PERCENTILE | 151 | 152 | 152 | 151 | - |
| 395 | WESTERN NEW ENGLAND UNIVERSITY | LSAT SCORE AT 25TH PERCENTILE | 151 | 151 | 147 | 145 | - |
| 396 | WESTERN STATE SCHOOL OF LAW | LSAT SCORE AT 25TH PERCENTILE | 148 | 149 | 149 | 148 | - |
| 397 | WHITTIER COLLEGE | LSAT SCORE AT 25TH PERCENTILE | 150 | 149 | 148 | 145 | - |
| 398 | WIDENER UNIVERSITY-DELAWARE | LSAT SCORE AT 25TH PERCENTILE | 150 | 149 | 148 | 147 | - |
| 399 | WIDENER UNIVERSITY-HARRISBURG | LSAT SCORE AT 25TH PERCENTILE | 148 | 148 | 147 | 145 | - |
| 400 | WILLAMETTE UNIVERSITY | LSAT SCORE AT 25TH PERCENTILE | 154 | 152 | 151 | 148 | - |
| 401 | WILLIAM AND MARY SCHOOL OF LAW | LSAT SCORE AT 25TH PERCENTILE | 160 | 161 | 161 | 161 | - |
| 402 | WILLIAM MITCHELL COLLEGE OF LAW | LSAT SCORE AT 25TH PERCENTILE | 152 | 150 | 150 | 149 | - |
| 403 | WISCONSIN, UNIVERSITY OF | LSAT SCORE AT 25TH PERCENTILE | 158 | 158 | 157 | 156 | - |
| 404 | WYOMING, UNIVERSITY OF | LSAT SCORE AT 25TH PERCENTILE | 151 | 150 | 149 | 149 | - |
| 405 | YALE UNIVERSITY | LSAT SCORE AT 25TH PERCENTILE | 171 | 170 | 170 | 170 | - |
Sources: Data for total first-year enrollment, 2010–2013, are from the American Bar Association Section of Legal Education and Admissions to the Bar, which obtains enrollment statistics from its annual questionnaire to law schools and makes the statistics available on its website at http://www.americanbar.org/groups/legal_education/resources/statistics.html. Data for 25% LSAT score, 2010–2012, are from the Law School Admission Council, LSAC Official Guide to ABA-Approved Law Schools. Data for 25% LSAT score, 2013, are from the American Bar Association Section of Legal Education and Admissions to the Bar, Standard 509 Information Reports, http://www.abarequireddisclosures.org/.
Changes in First-Year Enrollment and Average LSAT Score at the 25th Percentile, 2010‒2013
Contact us to request a pdf file of the original article as it appeared in the print edition.


