This article originally appeared in The Bar Examiner print edition, Spring 2026 (Vol. 95, No. 1), pp. 51–53. By Bob Schwartz, JD, PhDFor decades, The Bar Examiner’s Testing Column has explored how bar exam scores should be interpreted and, just as importantly, how they should not. Prior columns have explained why scaled total scores are the appropriate basis for high-stakes licensure decisions, why subscores and percentile-type measures are easily misunderstood, and why the appropriate use and interpretation of contextual performance information is crucial. The transition to the NextGen UBE reflects a new assessment design that upholds these long-standing score-reporting principles. This column explains how NextGen score reporting aligns with, and builds upon, NCBE’s established approach to scaling, reliability, and responsible use of score information.
Score reporting has long been recognized as one of the most consequential aspects of licensure testing. Scores are not merely numerical outcomes; they are the primary means by which examinees, jurisdictions, and other stakeholders interpret performance, make decisions, and plan next steps. For that reason, score reports must be carefully designed to convey meaningful information while avoiding over- or misinterpretations.
One Exam, One Score
The most important starting point is also the simplest: The NextGen UBE reports one overall scaled score (hereafter the “NextGen UBE score”). That score is reported on a 500 to 750 scale and is the only score used to determine whether an examinee meets a jurisdiction’s adopted passing standard.
This approach is consistent with long-established NCBE guidance that high-stakes licensure decisions should be based on the most reliable score available, which is almost always the overall score rather than that of any component or other subset of items.1 Earlier Testing Columns emphasized that properly scaled and equated total scores are the most defensible measures for licensure decisions.2
Scaling and equating, two important psychometric processes undergirding total scaled scores, account for small differences in difficulty across forms and administrations so that a given scaled score represents the same level of performance regardless of when the exam is taken, a principle earlier Testing Columns on grading, scaling, and standards covered.3 This comparability allows jurisdictions to apply consistent passing standards over time.
It is equally important to understand what a scaled score is not. It is not a percent correct, a total number of points (i.e., a raw score), or a direct measure of performance within an individual subject area. As prior Testing Columns have noted, raw scores and component-level results often explain far less than examinees expect, especially when taken out of context.
Contextual Performance Information: Percent Below
In addition to the NextGen UBE score, individual score reports will include contextual performance information described as Percent Below. These values appear at several levels, including the total score and groupings by question format and by subject area.
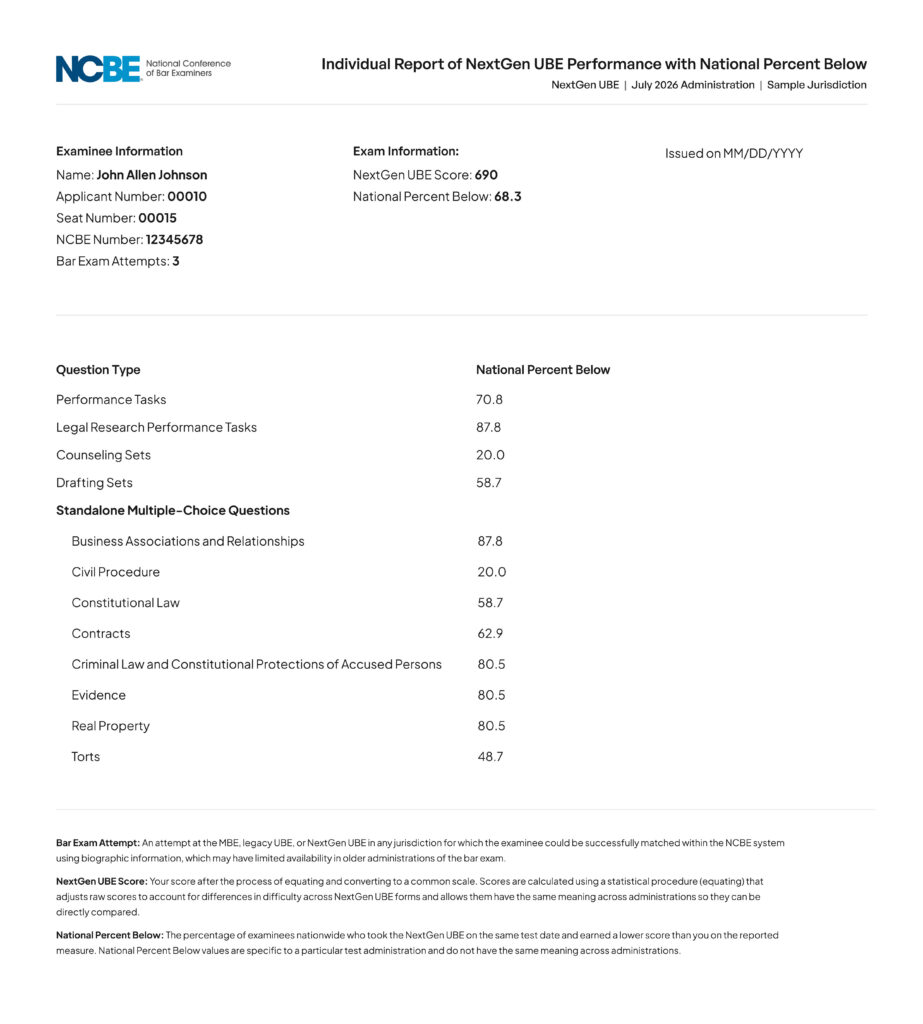
A Percent Below value represents the percentage of examinees in a given administration who scored lower on that measure. For example, a Percent Below value of 68 indicates that the examinee scored higher than 68 percent of examinees in that particular administration on that measure. Percent Below values resemble percentile ranks, and they share the same fundamental limitation: They provide ordinal information within a cohort but are not designed for comparison across administrations.4
Percent Below values add context that a scaled score alone cannot provide. Whereas a scaled score answers the question of whether an examinee met a jurisdiction’s passing standard, Percent Below values situate performance within the national cohort of examinees who tested during the same administration. For jurisdictions, this information supports internal analysis of score distributions and performance patterns.
At the same time, Percent Below values require careful explanation. Because they reflect the score distribution of a specific cohort, they should not be used to compare performance across administrations or to draw conclusions about trends over time. As prior Testing Columns have cautioned, percentile-type measures are particularly vulnerable to overinterpretation when these limits are not acknowledged.5
Percent Below values should also not be interpreted as indicators of proximity to passing. Passing decisions are based on the jurisdiction’s adopted passing standard applied to the total scaled score. An examinee with a relatively high Percent Below value may still fall below the passing standard, whereas another with a lower Percent Below value may pass, depending on that administration’s score distribution and the adopted passing standard for their jurisdiction. For example, an examinee who earns a similar scaled score across two administrations may nevertheless see a substantial change in Percent Below values if the overall performance of the testing cohort differs. This is commonly seen between February and July exams. Conversely, a noticeable change in Percent Below value does not necessarily indicate a large change in scaled performance. Percent Below value reflects relative standing within a particular administration, not a change in scoring accuracy.
Additional Performance Information
Jurisdictions will receive individual NextGen UBE reports from NCBE that include Percent Below values for several groupings within the exam, such as constructed-response question types and standalone multiple-choice categories organized by Foundational Concepts and Principles. These indicators provide contextual performance information intended to help interpret examinee results across the exam’s integrated components.
Consistent with long-standing NCBE score-reporting practices, these indicators are not used as subscores for licensure decisions.6 Passing determinations remain based on the overall scaled score, which provides the most reliable measure of examinee performance on the exam as a whole. Earlier Testing Columns have discussed why component-level scores often have substantially lower reliability than total scores and why apparent differences among them can be easily overinterpreted.7
At the same time, the contextual indicators serve an important interpretive and constructive purpose. For jurisdictions, they offer insight into performance patterns across the different types of legal work represented on the exam. For examinees—particularly those who do not meet the passing standard—such indicators can help identify areas where additional preparation may be most beneficial before a future exam attempt.
Because the NextGen UBE is designed to assess the application of legal knowledge across research, analysis, drafting, and client counseling tasks (among others), it also creates opportunities to examine performance patterns across the skills required for entry-level legal practice. As additional administrations are conducted and more data become available, NCBE will continue studying the reliability, interpretability, and usability of disaggregated performance information. Ongoing research will help determine whether and how additional, refined reporting may be incorporated into future score reports.
Reporting Formats and Jurisdictional Control
NextGen UBE score information is delivered through individual score reports, jurisdiction score reports, and score distribution reports at both the national and jurisdiction levels. Individual score reports, if jurisdictions choose to release them, communicate the official result and selected contextual information to examinees.
Unlike with legacy UBE reporting, individual NextGen UBE score reports will be provided to all jurisdictions. How and when those reports are distributed to examinees remain each jurisdiction’s decisions. Some jurisdictions may choose to provide full individual score reports to all examinees; others may release only pass/fail results or provide score information according to locally established timelines.
Conclusion
At a system level, score reporting is designed to address three essential considerations: (1) whether the examinee met the jurisdiction’s passing standard; (2) how performance compares within the same exam administration; and (3) where future preparation might appropriately be focused. Equally important, it avoids inviting interpretations that the scores cannot support. Percent Below values are not tools for cross-administration comparisons, predictions, or disaggregating an integrated exam into independent parts.
As jurisdictions and examinees become more familiar with NextGen UBE score reporting, continued attention to clear explanation and interpretive caution will remain essential. Score reports are most effective when they illuminate performance while respecting the appropriate use and interpretation of score information.
Notes
- See Susan M. Case, “The Testing Column: Common Goals with Increasingly Similar Outcomes: Jurisdiction Approaches to Bar Exam Grading, Scoring, and Standards,” 80(1) The Bar Examiner 53–55 (March 2011). (Go back)
- Id. (Go back)
- Id. (Go back)
- See Mark A. Albanese, PhD, “The Testing Column: Subscore National Percentile Ranks: The Undead,” 86(1) The Bar Examiner 56–59 (March 2017). (Go back)
- Id. (Go back)
- Mark A. Albanese, PhD, “The Testing Column: Differences in Subject Area Subscores on the MBE and Other Illusions,” 83(2) The Bar Examiner 26–31 (June 2014); Susan M. Case, PhD, “The Testing Column: Quality Control for Developing and Grading Written Bar Exam Components,” 82(2) The Bar Examiner 34–37 (June 2013). (Go back)
- Id. (Go back)

Bob Schwartz, JD, PhD, is Managing Director of Psychometrics for the National Conference of Bar Examiners.
Contact us to request a pdf file of the original article as it appeared in the print edition.