This article originally appeared in The Bar Examiner print edition, Fall 2018 (Vol. 87, No. 3), pp 9–17.
By Michael T. Kane, Ph.D., and Joanne Kane, Ph.D.

Licensure examinations such as the bar exam are high-stakes tests. A high-stakes test is defined by the Standards for Educational and Psychological Testing as “a test used to provide results that have important, direct consequences for individuals, programs, or institutions involved in the testing.”1 In the definition provided in the Standards, the focus is on the exam taker and, as perhaps in our case, the exam administrator. However, we argue that the bar exam and many other professional licensure examinations should also be considered high-stakes from the perspective of the public; professional licenses are designed to protect the public from individuals seeking to practice who lack the requisite knowledge, skills, and abilities to adequately do so. Members of the public are counting on professional licenses to help ensure that a practitioner they would employ is at least minimally ready for practice.
The process of establishing a passing score is commonly referred to as standard setting. Standard setting in the licensure examination context is designed to address the basic policy question of how high an examinee’s score must be for the examinee to pass the examination.
Establishing a passing score on such a high-stakes test is a critical component of ensuring the testing program’s public protection function. There are costs to both individuals and the public associated with setting the bar too low or too high. If the bar is set too low, members of the public may be harmed through ineffective legal representation or actual malpractice. The public will have less confidence in members of the profession, and as a result, “consumer uncertainty” will increase. On the other hand, if the bar is set too high, would-be lawyers who would be able to competently represent clients will be inappropriately prevented from doing so. Individual examinees seeking to enter the profession, serve the public, and repay their student loans will suffer, and members of the public could be harmed by having their access to justice unduly limited via increased direct costs of representation or through increased caseloads for individual lawyers.
The process of establishing a passing score is commonly referred to as standard setting. Standard setting in the licensure examination context is designed to address the basic policy question of how high an examinee’s score must be for the examinee to pass the examination. This standard represents the basic level of competence expected for entry-level practice. This article discusses the concept of standard setting, how standards facilitate the process of making licensure decisions, and a few of the methods used to set standards in high-stakes contexts.
Why Do We Have Standards?
The adoption of a passing score for a licensure examination such as the bar exam changes what could be subjective decisions into objective or even mechanical ones and thereby promotes fairness and transparency. The process is highly efficient, reliable, and replicable. Determining whether an examinee passes or fails based on one clear criterion—his or her scaled score in relation to the passing score—is fast, unambiguous, and automatic.
In licensure decisions, the decision rule—in our case, the rule that is applied to make pass/fail determinations—typically specifies that if an examinee’s scaled score is at or above the passing score, the examinee passes the test, and if the examinee’s scaled score is below the passing score, the examinee fails the test.2 This simple decision rule can easily be applied across examinees more or less automatically; no human judgment need come into play in the application of the rule. Of course, plenty of human judgment comes into play in the broader decision context in terms of identifying the requisite knowledge, skills, and abilities to be measured; designing the measurement instrument itself (i.e., the exam and its components); scoring the written components of the exam; and setting the passing score in the first place. But once the passing score is set and the scoring is completed, it is a simple matter to apply the decision rule.
To the extent that the standard of performance represented by the passing score is accepted, decisions based on that standard tend to be accepted by relevant stakeholders. The application of a clear standard has been described as a way of making a decision without appearing to decide.3 It is hard to imagine a legitimate challenge, from the perspective of fairness, to the simple process of comparing a score to a passing score.
Are Standards Arbitrary?
Passing scores do not exist until some group develops them. Standards are set rather than “found” or estimated. The question, therefore, is not whether a passing score is “accurate” but rather whether the passing score, as set, achieves its purpose at an acceptable cost. Setting the passing standard is, in essence, a balancing act whereby policymakers weigh the benefits and costs of choosing a particular standard; the goal is to avoid setting the standard too high or too low.
Given a set of scores on a test, an increase in the passing score will generally decrease the pass rate, and a decrease in the passing score will generally increase the pass rate.4 Even modest changes in the passing score can yield substantial changes in pass rates, and these changes can vary substantially across groups (e.g., race/ethnicity, gender).
Passing scores do not exist until some group develops them. Standards are set rather than “found” or estimated. The question, therefore, is not whether a passing score is “accurate” but rather whether the passing score, as set, achieves its purpose at an acceptable cost. In 1978, a prominent researcher, Gene Glass, suggested that the results of educational standard setting tend to be arbitrary.5 In response, a number of researchers acknowledged that standards are inherently judgmental but argued that they need not be arbitrary in the sense of being unjustified or capricious.6 Further, context matters—the extent to which arbitrariness is a problem depends on how much it interferes with the intended use of the standard and, perhaps, the kind and degree of severity of unintended consequences.
Whenever a continuous variable is cut, the position of the cut can seem arbitrary. For example, the current maximum gross monthly income limit for SNAP (Supplemental Nutrition Assistance Program) recipients is $1,307.7 Surely someone who earns $1,308, or $1,307.01, is effectively as food insecure as someone who earns $1,306.99. A penny or two—or even a dollar or two—one way or the other will not meaningfully influence a person’s ability to provide for him- or herself and/or others. And yet, for a federal program serving millions8 of Americans to be efficiently run and for benefits to be distributed in consistent ways, clear guidelines must exist. Which is to say, policies must be set.
Adopting a passing score for a licensure examination is, essentially, adopting a policy. Changes in policies can have dramatic effects. Changes to the SNAP income limits in either direction would affect millions of people and families.
On a “lighter” note, on June 17, 1998, the National Institutes of Health adopted new cut scores for the body mass index (BMI), a measure of percentage body fat based on a person’s weight and height measurements.9 As a result, almost 30 million Americans were “suddenly” reclassified as clinically overweight, and several million were reclassified as clinically obese.
The inherent arbitrariness associated with standard setting needs to be controlled by providing support for the particular standard chosen. The 1998 changes to the BMI cut scores were developed judgmentally by a committee, but they were supported by clinical research, and the general locations of the cut scores were, therefore, far from unjustified or capricious.
To be considered acceptable (that is, to be defensible and comport with best practices in the measurement field), standards must meet certain criteria:
- They must be developed using generally accepted procedures based on relevant data.10
- They must be at an appropriate level or, at the very least, not at an obviously inappropriate level.
- They must be applied consistently over individuals and occasions.
In a paper titled “Justifying the Passing Scores for Licensure and Certification Tests,” this author (Michael Kane), along with the two co-authors of the paper, proposed what they called the “Goldilocks Criteria” for evaluating passing scores and the standard-setting methods used to generate them:
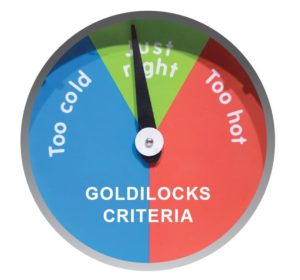 The ideal performance standard is one that provides the public with substantial protection from incompetent practitioners and simultaneously is fair to the candidate and does not unduly restrict the supply of practitioners. We want the passing score to be neither too high nor too low, but at least approximately, just right.11
The standard should be high enough to provide assurance that new practitioners have certain competencies but not so high as to have serious negative consequences.
A Look at Standard Setting in Other High-Stakes Contexts
In thinking about standard setting for test scores, it can be useful to consider how standards are set in other high-stakes contexts. The organizations that develop pharmaceutical standards and other health-related standards generally rely on empirical research relating input variables to various outcomes. To develop these standards, they may use dosage-response curves, which represent the empirical relationship between an input (e.g., the dosage of a medication) and an outcome (e.g., the response in terms of pain reduction). A variety of key stakeholders, including patients, doctors, and health organizations, would agree that the dosage should be high enough to achieve the intended outcome (e.g., control of pain) but not so high as to cause unnecessary side effects or unintended consequences.
Dosage-response curves, like those shown in Figures 1 through 3, can be used to suggest or to check on the general location for a standard dosage. As illustrated in Figure 1, for low dosages, the response may be very limited, and the response may not increase much as the dosage increases, until it gets into a critical range where the effect increases fairly quickly as a function of the dosage. For higher dosages, the response often levels off, or plateaus. In order to achieve a high response, the dosage should be at or near the high end of the critical range. Going beyond the critical range does not add much to the expected response, and using higher dosages may lead to toxic side effects or could be costly (in terms of actual dollars and/or the ability to treat as many patients as possible) if the medication is expensive to produce or in short supply. For the dosage-response curve shown in Figure 1, a dosage of about 30 or a little higher (e.g., 31 or 32) would seem to be an optimal choice in terms of achieving the intended response without the unnecessary risks that might be associated with higher dosages.
Most dosage-response curves are not as sharp as the curve in Figure 1. For the dosage-response curve shown in Figure 2, 30 may again be a reasonable candidate for the standard dosage, but the range of acceptable values—that is, the dosage values yielding a reasonable response, without unnecessarily risking significant side effects—is much wider as compared to the clear-cut case shown in Figure 1, where no response is obtained at all until the dosage approaches 30 and where the response plateaus slightly above 30. In Figure 2, the range of acceptable values for the dosage extends from about 30 to about 40, or even further. For Figure 3, a dosage of 30 could be a reasonable choice for the standard, perhaps, but the range of plausible choices is much wider than in the curves shown in Figures 1 and 2.
Figure 1: Dosage-Response Curve—an “Easy” Case
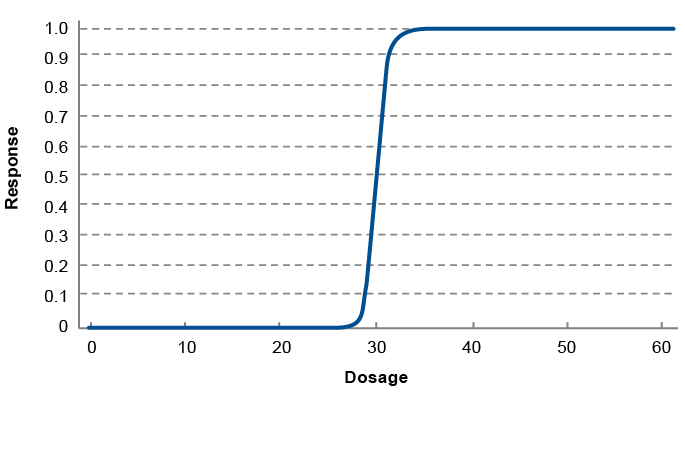
Figure 2: Dosage-Response Curve—an “Intermediate” Case

Figure 3: Dosage-Response Curve—a “Hard” Case

Dosage-response curves can be helpful in the standard-setting process, but they do not fully resolve the question of what the ideal standard would be. Note that even in the seemingly clearest of possible cases (Figure 1), it is not actually fully clear where the dosage should be set: Would the most appropriate dosage be 31 or 32, where the patient is getting most of the response? Or would a more appropriate dosage be closer to 35 or even 40, where it would be essentially certain that the patient will get the full response? The decision should depend on additional factors (e.g., potential side effects and direct and indirect costs) not reflected in the dosage-response curve.
Without additional information, the standard dosage can seem—and in fact can be—arbitrary. Figure 2 shows an intermediate case where the strength of response increases more gradually over a wider range of dosage levels, making it potentially more challenging to pinpoint an optimal dosage. And Figure 3 illustrates a case that barely hints at an optimal dosage. Additional considerations and constraints would be needed to determine the ideal dosage. The issue is one of balancing positive and negative consequences.
The use of dosage-response curves to set or evaluate standards involves the use of relevant empirical relationships to put bounds on the standard, followed by a judgment about where to put the standard within that range. The empirical results provide support for the general location of the standard (i.e., the critical range), but not for any single precise value within the range in most cases.
Unfortunately, although standards are often discussed as if there is an easy case akin to the one shown in Figure 1, high-stakes examinations usually present an ambiguous case more similar to the one shown in Figure 3. Thus, the standard-setting process will by necessity involve a substantial degree of human judgment. However, this human judgment need not be capricious; by involving individuals with relevant expertise, and by including a group of such individuals rather than relying on a single individual’s opinion, a reasonable standard can be set. As with dosage decisions, the goal in setting a passing score in the licensing context should be to achieve the desired outcome without introducing serious negative consequences. This generally involves trade-offs.
Standard Setting for High-Stakes Examinations
In high-stakes examinations, standards are typically set using judgmental standard setting—that is, relying on the judgments of individuals with relevant expertise to determine the appropriate standard. As applied to testing, judgmental standard-setting procedures involve the use of a group of professionals (e.g., experienced practitioners, judges, and bar examiners) to recommend a passing score on some score scale to represent a certain level of performance: the performance standard. For licensure tests such as the bar exam, the performance standard is the basic level of competence expected of new practitioners. The goal is to identify a passing score that reflects the performance standard and provides a reasonable basis for pass/fail decisions.
For licensure tests such as the bar exam, the performance standard is the basic level of competence expected of new practitioners. The goal is to identify a passing score that reflects the performance standard and provides a reasonable basis for pass/fail decisions.A number of empirical methods have been developed for setting standards on tests.12 Generally, the methods require panels of raters to conceptualize a minimally passing performance standard. The raters then use the performance standard to evaluate (i.e., rate) either examinee performances or test tasks (or both). That is, a group of experts could look at a sample of questions and say, “a minimally competent professional should be able to get at least half of these correct.” Or a group of experts could make a judgment about a particular examinee—they could read an essay written by the examinee, for instance, and make a direct judgment about whether or not the examinee is minimally competent. There are also techniques for combining the two types of judgment—judgments about whether the questions are appropriately difficult and how many a minimally competent examinee should be able to answer, combined with judgments about the particular performances of individual examinees. The resulting data can be used to yield both a suggested passing score and/or a range of scores within which the suggested passing score would be considered reasonable.13
The results of a judgmental standard setting are not usually reported as curves (like Figure 2), but they could be presented and used in this way (based on the suggested passing score and the range of scores within which the suggested passing score might fall). The data available in judgmental standard setting are typically more limited than in the pharmaceutical case and are based on judgment rather than empirical clinical studies, but the data can be put into essentially the same mathematical form.
Judgmental standard-setting procedures may be evaluated according to several criteria:
- One evaluative criterion might be procedural fairness or its cousin, methodological appropriateness: were the procedures used in the standard-setting exercise reasonable, thorough, and transparent?
- Another criterion would be some sort of reliability measure or evaluation of internal consistency: are the data consistent across tasks, panels, and raters within panels?
- Finally, the procedure could be evaluated based on external criteria: are the results consistent with those of other studies using the same or different methods? Are the results consistent with those of historical trends and/or with a general sense of what would be reasonable? If not, is the rationale for the difference known and accepted?
Potential negative consequences can be particularly relevant in setting upper bounds for the passing score. For example, the location of a passing score can have a major impact on pass rates across demographic groups.14 If there are two groups of test takers with different score distributions, and if the passing score is near the middle of the score distribution for the lower-scoring group (which is not uncommon) but in the lower tail of the distribution for the higher-scoring group, even a modest increase in the passing score can substantially increase the failure rate for the lower-scoring group while not having much impact on the higher-scoring group.
As a last example of the consequences and trade-offs associated with setting a particular standard, let’s consider a hypothetical examination. Imagine that two groups have different score distributions on the test. Groups of interest often include race/ethnicity and gender but could include any groups significant in the social context. Further imagine that the set passing score is near the middle of the score distribution for one of the groups (i.e., about half of the examinees achieved a score at or above the set passing score) but in the lower tail of the score distribution for the other group (i.e., the majority of the examinees achieved a score at or above the passing score).
This basic hypothetical scenario is illustrated in Figure 4, where the set passing score of 60 is near the middle of the score distribution for Group A but in the lower tail of the score distribution for Group B. Moving the passing score down from 60 to 50 would have a larger effect on Group A—which has a very high number of examinees whose scores fell between 50 and 60 and who would now pass the exam—than on Group B—which has very few examinees whose scores fell between 50 and 60. In this example, the impact of the change in passing score would not be equal across groups. There are direct and indirect consequences of any given passing score for an array of stakeholder groups, including the public, and for individuals.
Figure 4: Hypothetical Examination Example

Concluding Remarks
There is no generally agreed-upon single best method for conducting a standard-setting study for a high-stakes licensure examination. That said, it can be useful to explore what other licensure organizations have done in setting their standards, what other jurisdictions have done, and what the Standards for Educational and Psychological Testing recommend. In addition, the methods typically used in health-care standard setting (e.g., dosage-response curves) may provide a useful model for talking about standard setting in general. The health-care approach makes extensive use of empirical research and also tries to strike a balance between competing goals.
As mentioned at the beginning of this article, standard setting in the licensure examination context is designed to address the basic policy question of how high an examinee’s score must be for the examinee to pass the examination. Although empirical data should play a central role in standard setting, ultimately standards are set, not “found” or estimated. Thus, standards are not evaluated in terms of their accuracy per se but rather in terms of whether they support the goals of the program without introducing unacceptable and unintended consequences. In the context of the bar examination, the passing score should be high enough to protect the public, but not so high as to be unduly limiting to those seeking to enter the profession.
Editor’s Note: This article is partially based on Dr. Michael T. Kane’s presentation, “Standard Setting for Licensure Examinations,” at the 2018 NCBE Annual Bar Admissions Conference held on April 19–22, 2018, in Philadelphia, Pennsylvania.
Notes
- American Educational Research Association, American Psychological Association, and National Council on Measurement in Education, Standards for Educational and Psychological Testing 214 (American Educational Research Association 2014).(Go back)
- M.T. Kane, B.E. Clauser & J. Kane, “A Validation Framework for Credentialing Tests,” in Testing in the Professions: Credentialing Policies and Practice (Eds. S. Davis-Becker and C.W. Buckendahl, National Council on Measurement and Education 2017).(Go back)
- T. Porter, Trust in Numbers: The Pursuit of Objectivity in Science and Public Life 8 (Princeton University Press 1995).(Go back)
- This might seem like an obvious point, but we note that the impact in terms of pass rate will depend on both what the underlying distributions of scores look like and where the passing score falls within the distribution.(Go back)
- G.V. Glass, “Standards and Criteria,” 15(4) Journal of Educational Measurement (Winter 1978) 237–261.(Go back)
- R. Hambleton & M. Pitoniak, “Setting Performance Standards,” in Educational Measurement 433–470 (Ed. R.L. Brennan, American Council on Education and Praeger Publishers 4th ed. 2006).(Go back)
- United States Department of Agriculture Food and Nutrition Service, Supplemental Nutrition Assistance Program (SNAP), https://www.fns.usda.gov/snap/eligibility#What%20are%20the%20SNAP%20income%20limits? (last visited Sep. 14, 2018).(Go back)
- United States Department of Agriculture Food and Nutrition Service, Supplemental Nutrition Assistance Program (SNAP), https://www.fns.usda.gov/pd/supplemental-nutrition-assistance-program-snap (last visited Sep. 14, 2018).(Go back)
- L. Shapiro, “Fat, Fatter: But Who’s Counting?,” Newsweek, June 15, 1998, at 55.(Go back)
- For a recent review of some such standard-setting procedures, see M. Albanese, “The Testing Column: Standards? We Don’t Need No Stinking Standards!,” 86(2) The Bar Examiner (June 2017) 36–40.(Go back)
- M. Kane, T. Crooks & A. Cohen, “Justifying the Passing Scores for Licensure and Certification Tests.” Paper presented at the annual meeting of the American Educational Research Association, Chicago, March 1997, p. 8.(Go back)
- See Albanese, supra note 10, which goes into some detail on a few of these empirical methods that have been developed for setting standards on tests.(Go back)
- For additional detail on standard-setting methods, see B.E. Clauser, M.J. Margolis & S. Case, “Testing for Licensure and Certification in the Professions,” in Educational Measurement 701–731 (Ed. R.L. Brennan, American Council on Education and Praeger Publishers 4th ed. 2006); Hambleton & Pitoniak, supra note 6; M. Kane, “Standard Setting for Licensure Examinations,” 70(4) The Bar Examiner (November 2001) 6–9; M. Kane, “Practice-Based Standard Setting,” 71(3) The Bar Examiner (August 2002) 14–24; M. Kane, “Conducting Examinee-Centered Standard-Setting Studies Based on Standards of Practice,” 71(4) The Bar Examiner (November 2002) 6–13; or M.J. Zieky, M. Perie & S.A. Livingston, Cutscores: A Manual for Setting Standards of Performance on Educational and Occupational Tests (Educational Testing Service 2008).(Go back)
- A. Mroch, M. Kane, D. Ripkey & S. Case, “Impact of the Increase in the Passing Score on the New York Bar Examination: February 2006 Bar Examination.” Report prepared for the New York Board of Law Examiners by the National Conference of Bar Examiners, June 19, 2007.(Go back)
 Michael T. Kane, Ph.D., is the holder of the Samuel J. Messick Chair in Test Validity at Educational Testing Service (ETS). He was Director of Research for the National Conference of Bar Examiners from 2001 to 2009. From 1991 to 2001, he was a professor in the School of Education at the University of Wisconsin–Madison, where he taught measurement theory and practice. Prior to that, Kane served as vice president for research and development and as a senior research scientist at American College Testing (ACT), where he supervised large-scale validity studies of licensure examinations. Kane holds an M.S. in statistics and a Ph.D. in education from Stanford University.
 Joanne Kane, Ph.D., is the Associate Director of Testing for the National Conference of Bar Examiners.
Contact us to request a pdf file of the original article as it appeared in the print edition.